 14 min read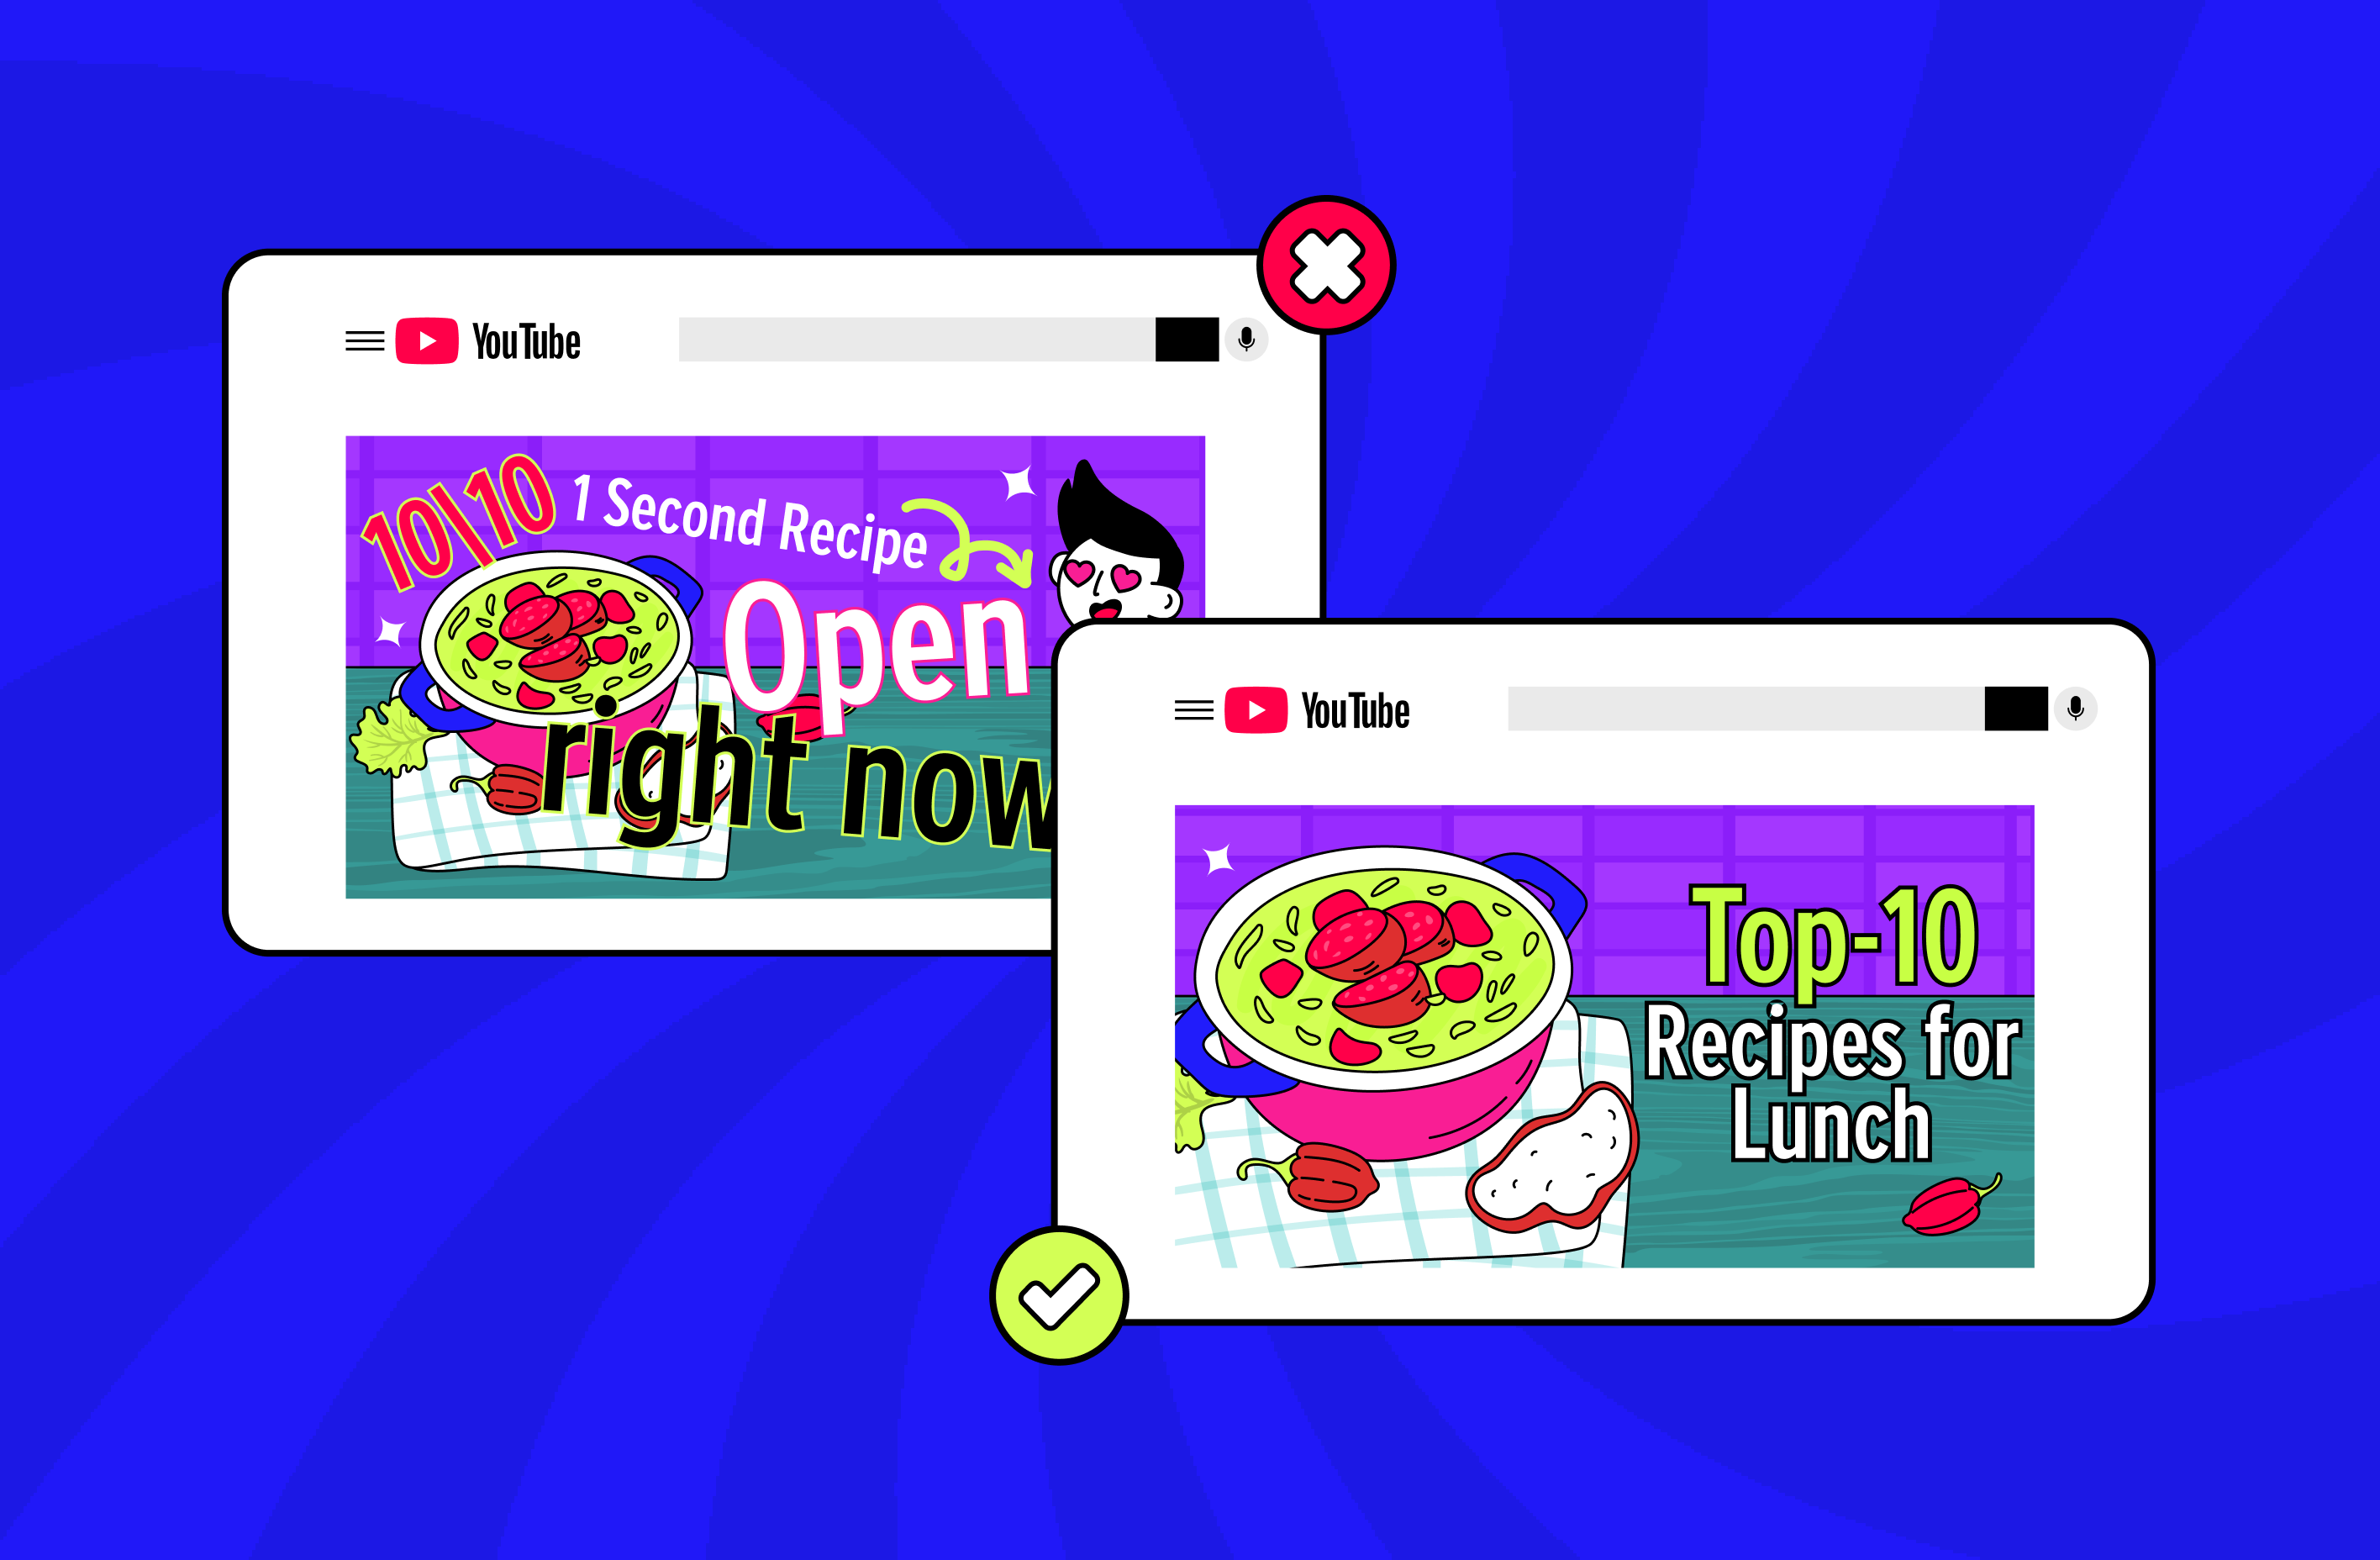

TL;DR
- Since August 24, 2026, YouTube counts a public view from the first frame across long-form video, Shorts, podcasts, and live. The older, stricter definition survives in Analytics as engaged views, and that is still what Partner Program earnings and eligibility run on.
- Public view counts rose on that date for many channels with no change in content, so judge progress on engaged views, not on the number under the player.
- Test & Compare runs up to three titles, three thumbnails, or three full title-and-thumbnail packages on one video, and picks the winner by watch time, not by click-through rate (CTR).
- End screens work only in the last 5–20 seconds of a video that runs at least 25 seconds, and they never appear on videos set as made for kids.
- Captions and translated metadata open a video to people searching in another language. YouTube puts over two-thirds of a typical creator’s watch time outside their home area.
- The gap between uploads is the one leak packaging cannot close. A 24/7 stream built from pre-recorded video keeps watch time accumulating on the days nothing new goes up.
What a view means since August 24, 2026
Start here, because the number you are measuring changed underneath you. As of August 24, 2026, YouTube counts a view the moment playback begins, from the very first frame, and the rule covers every format. The previous definition did not disappear. It was renamed: an engaged view is a viewer clicking to watch or staying past the opening seconds, and that is the metric behind monetization.
Two consequences follow. Public view counts got easier to earn, so a channel can look healthier without a single thing improving. And every ratio with views in the denominator fell on the same day, including likes per view and subscribers per view.
What did not move: click-through rate (CTR), average view duration (AVD), and audience retention are all calculated from engaged views, so they read exactly as before. Recommendations are unchanged too.
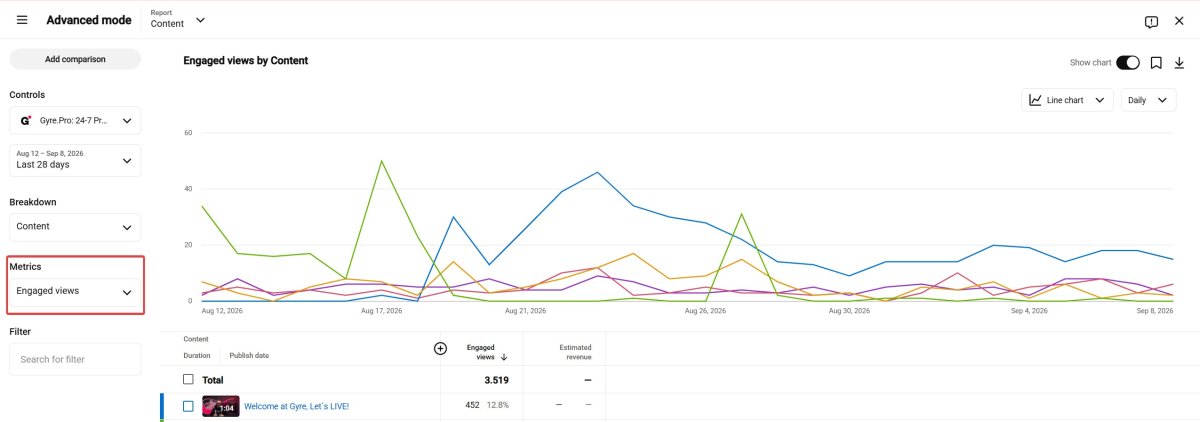
Engaged views live in Advanced mode, not on the default dashboard, which is why most creators have not looked at them yet.
If a specific metric on your channel is sliding and you want to trace it to one cause, our walk-through on why YouTube metrics drop and how to diagnose them runs the funnel step by step.
The leaks, and what each one costs
| Mistake | What it actually costs | First move |
|---|---|---|
| An opening that stalls | Retention in the first segment, and the AVD that follows from it | Cut everything before the promise and open on the payoff |
| Packaging you never tested | Impressions that never turn into views | Run one A/B test in Test & Compare on an older video |
| No end screen | The session ends on your video instead of continuing into the next one | Add an end screen to the final 20 seconds |
| No captions, no translated metadata | Viewers searching in another language never see the video | Caption your five strongest videos, then translate their titles and descriptions |
| Skipping Shorts entirely | The surface that reaches people who do not know you stays closed | Publish Shorts on their own schedule and judge them on their own metrics |
| Never opening Analytics | The same mistake repeats across every upload | Fifteen minutes a week on CTR, AVD, and retention |
| Leaving comments unanswered | Engagement signals and returning viewers both stay flat | Reply to the first wave of comments while the video is still being pushed |
| Silence between uploads | Nothing accumulates watch time on the days you do not publish | Put the existing archive on a continuous stream |
Mistakes with a measurable cost
An opening that stalls
Nobody can tell you a universal number of seconds, and the useful signal is not a rule of thumb anyway. It is your own retention curve, which shows the exact moment people left. Open three recent videos, look at the first segment of each, and see whether the drop lands on a logo animation, a channel greeting, or a recap of the last episode.
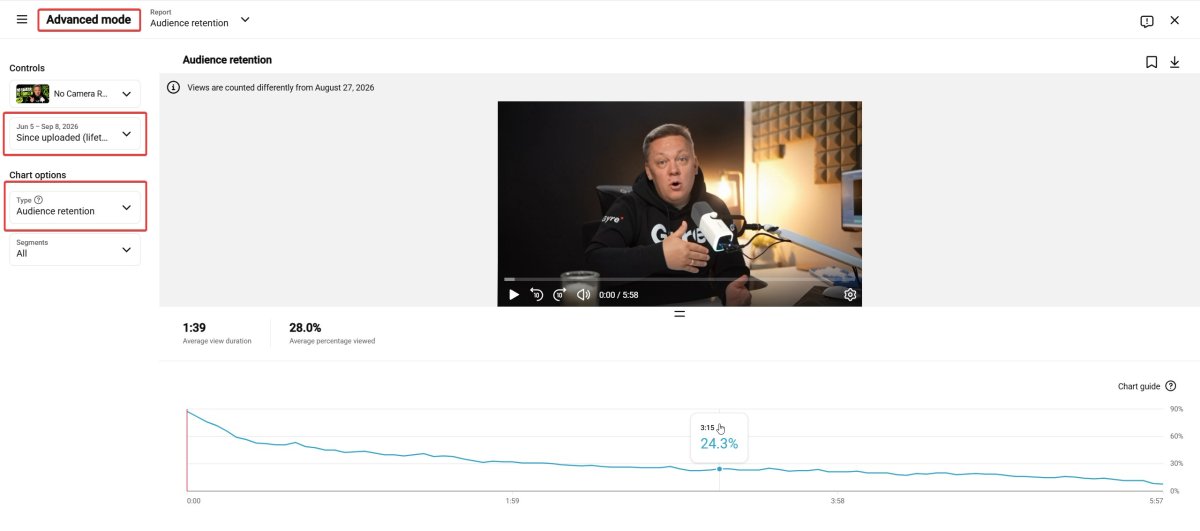
Fixing it is editorial work, not technical. Name the outcome the viewer gets, show a fragment of it, then start. Everything you cut from the front of the video moves the curve, and the curve is what feeds AVD. Our guide to raising average view duration covers the editing patterns that hold attention through the middle as well.
Packaging you never tested
A video that earns impressions and no clicks has a packaging problem, and guessing at it is the expensive way to solve it. Test & Compare, YouTube’s native A/B tool, takes up to three titles, three thumbnails, or three combined packages on one video and runs them concurrently for up to two weeks. It is desktop only, needs advanced features enabled, and does not work on Shorts, scheduled lives, or made-for-kids videos.
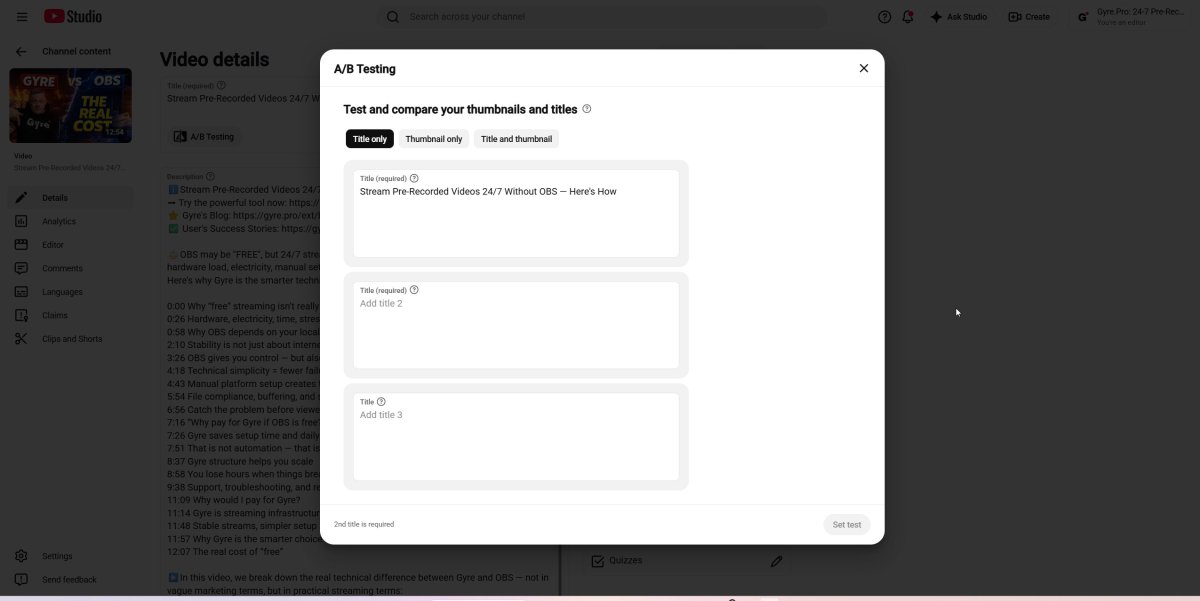
One detail catches most creators out: the winner is decided by watch time share, not by CTR. A louder variant that pulls clicks and loses people will lose the test. That is deliberate, and it is the same logic that governs how far a video travels afterwards. Setup, eligibility, and how to read the report are all in our full breakdown of YouTube’s title and thumbnail A/B testing tool, and the design side sits in our piece on getting a high CTR from your thumbnail and description.
No end screen
An end screen is the difference between a viewer finishing your video and a viewer starting your next one. YouTube allows them in the last 5–20 seconds of a video that runs at least 25 seconds, with up to four elements on standard 16:9. They are unavailable on made-for-kids videos, on mobile web outside iPad, and in the YouTube Music and Kids apps.
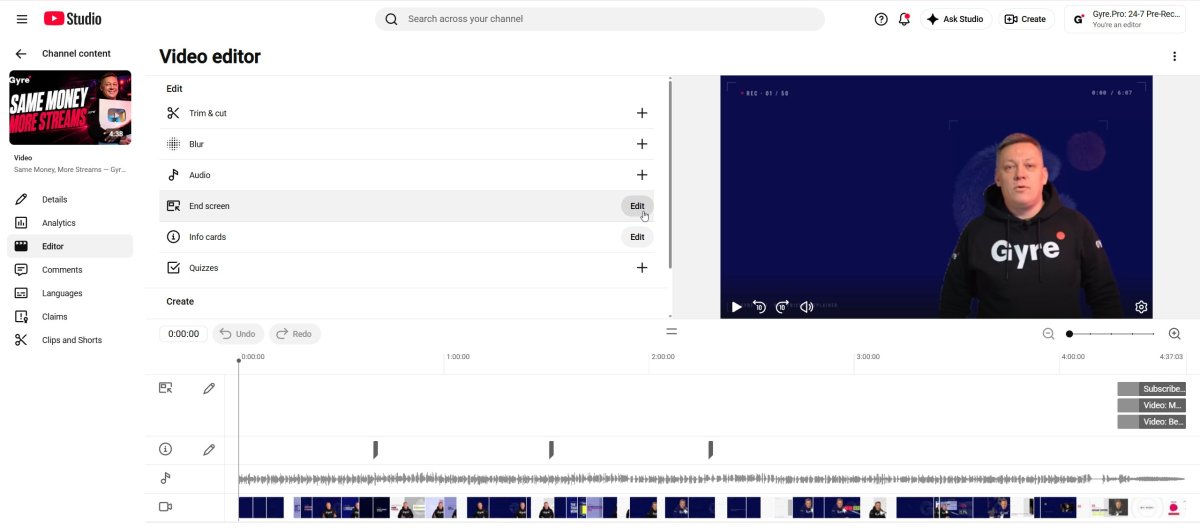
Point the element at something specific. “Best for viewer” lets YouTube choose, which is fine on a back catalogue, but a hand-picked next video works better when the current one belongs to a series.
No captions, no translated metadata
Captions get filed under accessibility and then forgotten, which quietly costs reach. YouTube states that over two-thirds of a creator’s audience watch time comes from outside their home area, that people who speak other languages can find and watch any video with subtitles, and that translated titles and descriptions can surface in search results for those viewers.
Same-language captions do work of their own. They keep the video watchable with sound off, in a noisy room, and for anyone deaf or hard of hearing. Auto-captions cover the basic case, but they misread accents, proper nouns, and jargon, so the ones on your best-performing videos are worth correcting by hand.
Skipping Shorts entirely
Plenty of long-form creators still treat Shorts as a separate job they have no time for. The cost is structural, not tactical: short-form is the surface where people who have never heard of you encounter the channel, and it runs on its own recommendation logic. Shorts also moved to first-frame view counting back in March 2025, so their public numbers have been inflated relative to long-form for over a year, and comparing the two counters directly tells you nothing.
Treat the formats as separate products with separate schedules. Judge Shorts on completion and replays; judge long-form on retention and AVD.
Meta-mistakes: the habits behind the habits
Never opening Analytics
Everything above is discoverable in fifteen minutes a week. Without that habit the same mistake ships on every upload, because nothing in the interface tells you that your intros are too long or that your CTR sits below your own median. Three numbers are enough to start: CTR, AVD, and the shape of the retention curve on your last five videos, always compared against your own channel rather than someone else’s benchmark.
Leaving comments unanswered
Comments are one of the few signals you can move directly on the day a video goes up. Replies pull people back to the video, keep the thread alive while YouTube is still deciding how far to push the upload, and give you the plainest possible read on what confused viewers. The pattern that works is unglamorous: answer the first wave properly, pin the question that came up three times, and use it as the opening of the next video.
Treating Google search as a growth channel
This one shifted under everybody in the last two years. Pew Research Center tracked the browsing of 900 US adults across 68,879 Google searches in March 2025 and found that people clicked a normal search result on 8% of visits where an AI summary appeared, against 15% where it did not. Google disputes the methodology, and the study measures clicks to websites rather than to videos, so read it as a direction, not a coefficient.
Either way the practical point holds. For most channels, external referrals are a thin slice of total views, and the mistake is budgeting effort as though Google were the front door. Check the External bucket in your traffic sources once, size it honestly, and spend the rest of your attention on the surfaces that actually deliver: suggested videos, the home feed, and YouTube search.
The days you do not publish
Every fix above improves an individual video. None of them do anything on a Tuesday when nothing new goes up, and for most channels that is five or six days out of seven. The graph digs its holes in those gaps, and no amount of thumbnail work fills them.
Continuous broadcasting is the one lever that operates on the empty days. Gyre streams pre-recorded video as a 24/7 live broadcast to YouTube, Twitch, and Kick from the cloud, so an archive you have already produced keeps accumulating watch time and keeps a live entry point open in the Live tab.
This is not a substitute for publishing, and looping weak content forever just produces background noise. Used deliberately, it removes the channel’s dependence on your upload calendar. What the format is and what YouTube’s rules allow are covered in our explainer on streaming pre-recorded video as live on YouTube.
A 30-minute audit you can run today
Run these in order on the videos you already have. Nothing here needs new footage.
- Open Advanced mode and add the engaged views column. Compare it against public views on anything published since late August.
- Sort your last 20 videos by impressions. Find the ones with high impressions and low CTR: those are your test candidates.
- Start one A/B test in Test & Compare on the oldest video in that list, with three genuinely different angles.
- Check the retention curve on your three most recent uploads and note where the first drop lands.
- Open the five videos with the most views and confirm each has an end screen pointing somewhere deliberate.
- Review the auto-captions on those same five, fix the obvious errors, and translate the titles and descriptions.
- Answer every unanswered comment on the most recent upload.
- Look at the External line in traffic sources and decide, with the number in front of you, how much of your effort it deserves.
Key Takeaways
- Reconcile your numbers against engaged views before you conclude anything. Part of what changed in 2026 was measurement, not performance.
- Pick one leak and close it properly instead of touching all eight. The A/B test on a high-impression, low-CTR video usually pays back fastest.
- Set your benchmark from your own last ten uploads of similar length and topic. Outside benchmarks describe someone else’s audience.
- Watch time is becoming a level to hold rather than a threshold to cross, which makes the empty days between uploads the part of the calendar worth engineering.
- Book the fifteen minutes a week. The habit is what turns this list into a process instead of a one-off cleanup.
FAQ
What is the most common mistake that costs views?
Across most channels it is the opening. A video that spends its first stretch on branding or a recap loses people before the content starts, and audience retention is the metric that records it. There is no universal cutoff in seconds, which is why the retention curve on your own videos is a better guide than any rule of thumb.
How do I know which of these mistakes I am making?
YouTube Analytics separates them cleanly. Impressions holding steady while CTR falls points at the title and thumbnail. CTR holding while AVD falls points at the content and its pacing. Impressions themselves falling means distribution narrowed, which is a different problem again.
Should I fix old videos or focus on new ones?
Both, in that order. Old videos with impressions and weak CTR are the cheapest wins available, and YouTube itself recommends running your first A/B tests on older uploads to limit the effect on the channel while you learn. Apply what the tests teach you to everything new from the start.
Why did my views go up while my engagement rates went down?
Because the denominator changed. Since August 24, 2026, the public counter registers a view at the first frame, so likes per view, comments per view, and subscribers per view all fell on the same date without anything happening to the underlying behaviour. Switch those comparisons to engaged views.
Does not streaming count as a mistake?
It is a missed opportunity, not an error. Nothing on your channel accumulates watch time on the days you do not publish, and a continuous stream built from pre-recorded video covers exactly that gap. It works as a complement to regular uploads, not as a replacement for them.
Do captions really affect how many views a video gets?
Indirectly, and mostly through discovery in other languages. YouTube says translated titles and descriptions can appear in search results for viewers who speak those languages, and that subtitles let those viewers watch once they arrive. Same-language captions matter for a different reason: they keep the video usable with the sound off.