
In a nutshell, YouTube Analytics is the set of live-stream tools available to all creators of this platform. Its main task is to evaluate the effectiveness of the created video content by crucial parameters. It also displays data about the progress of your channel: with it, you can determine what type of content you make is most interesting to your audience. Thus, by regularly monitoring the indicators from YouTube live stream analytics, you can consider your previous mistakes and optimize the further development strategy of your channel.
Real-Time Analytics
Regarding real-time analytics, YouTube offers five key metrics to measure YouTube live streams.
Concurrent Viewers
The Concurrent Viewers metric shows the number of viewers watching your live broadcast. The dynamics of these live views count YouTube indicator for a specific stream. You’ll be able to determine its most exciting and catchy parts. You can also compare peak rates for different streams to see which are most relevant to your audience.

Likes
Similarly, you can check the number of likes received during a particular stream. Once you've completed your stream, you can find your like stats in the video-on-demand (VOD) archive.

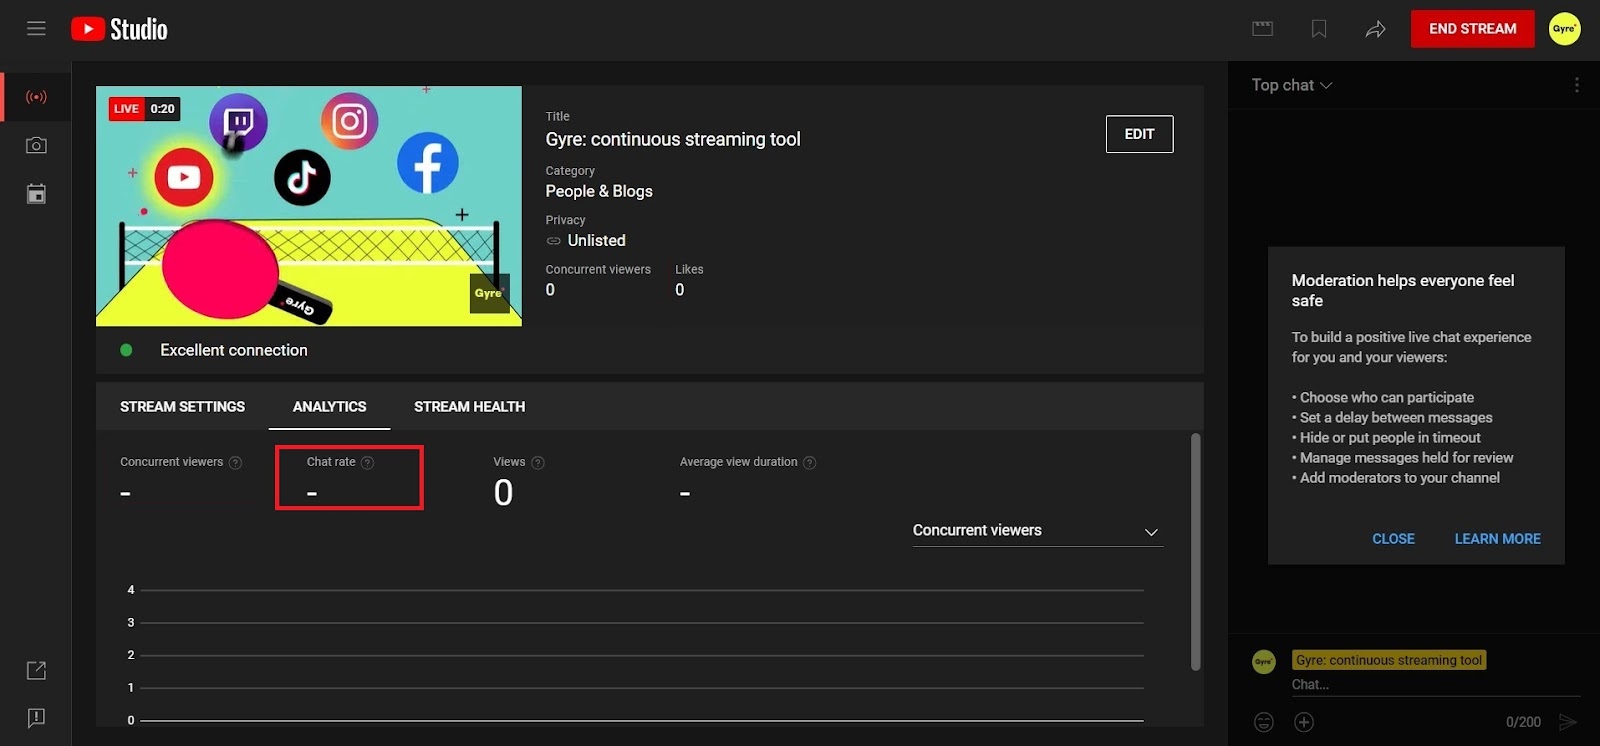
Chat Rate
The Chat Rate parameter will show you how many messages in the feed you received per minute during a particular stream. You need to view this metric directly during the stream since it will be reset to zero.
Playbacks
Playbacks is the total number of times your stream page is loaded (refreshed) in a web browser. It can be helpful for you to understand how many times during your stream your viewers were interrupted by something else.
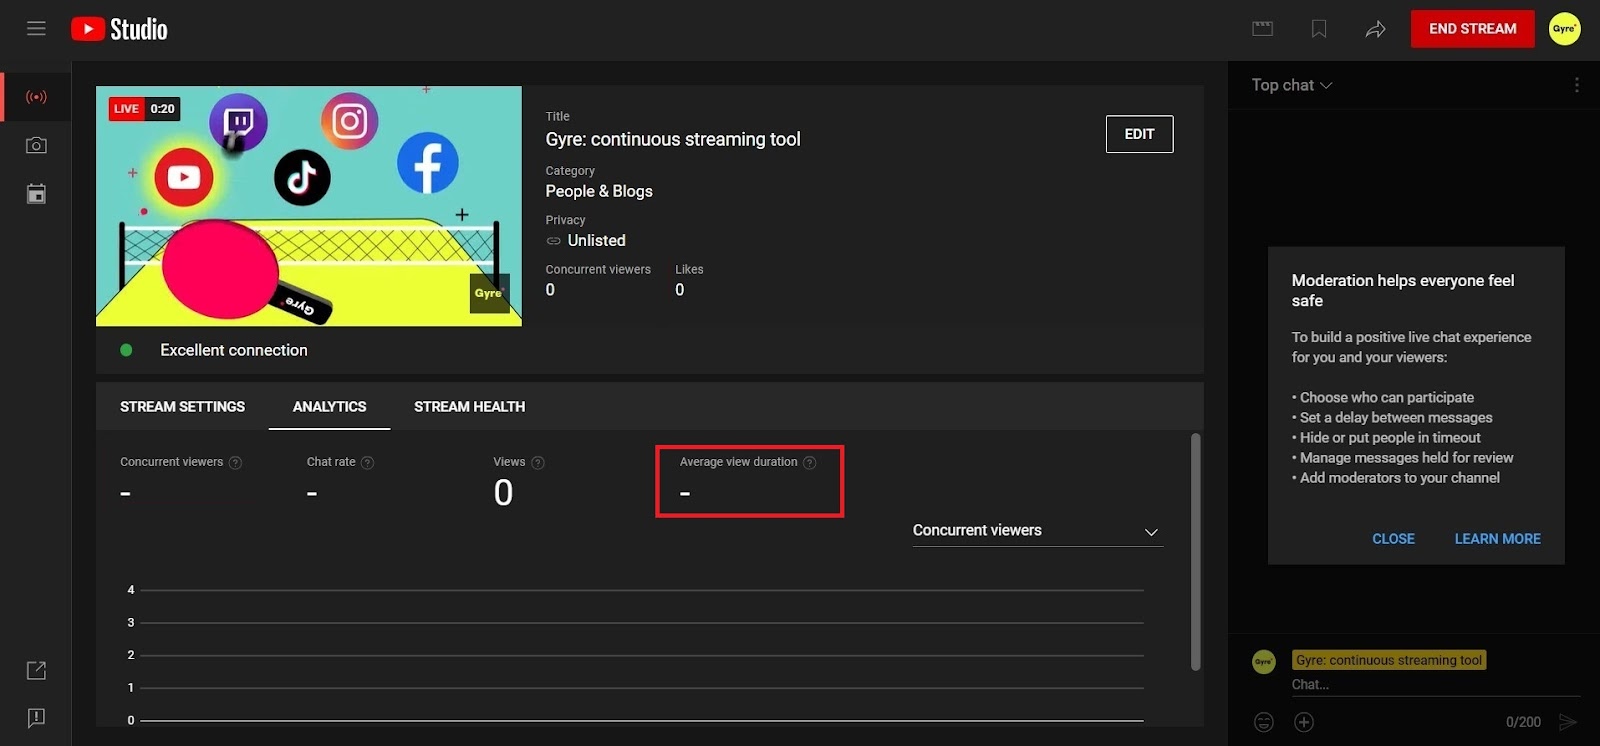
Average View Duration
The Average Watch Time will show you how long your viewers were with you live without interruption. It is the total time spent watching a particular stream divided by the number of plays. Knowing this indicator will help you determine the optimal time for your broadcasts so as not to bore your audience.
Post-Live Analytics
Five core metrics make sense to check at the end of your live broadcast. Note that this must be done within 48-72 hours after a specific broadcast. Otherwise, they will be lost.
Playbacks
You can monitor this parameter in real-time and after you complete your broadcast. In particular, by opening the VOD archive, you’ll understand how often the page with your online broadcast was loaded in your viewers’ web browsers. Thus, you can define your channel's most viewed YouTube live stream.
New Subscribers
The New Subscribers indicator will allow you to understand how many new subscribers you have attracted in one stream. This way, you can determine which stream contains the most effective triggers to expand your regular audience.
Total Watch Time
Some video titles turn out to be so clickbait and don’t live up to the audience's expectations that they turn them off after a few minutes of viewing. Want to make sure that's not your case and maximize the watch time of your streams? Then you will need to check the Total Watch Time indicator.
Peak Concurrents
The Peak Concurrents metric determines the maximum number of stream views. So you can understand which part of it was the most interesting for your audience.
Average View Duration
You can also find out the average watch time for your particular stream. The average view duration YouTube metric is calculated as the total video watch time divided by the total number of page loads with your stream (together with repeated ones).
From YouTube Analytics
In addition to the above indicators from YouTube live stream stats, you can also check the values of the following ones to get a fuller picture of your live stream.
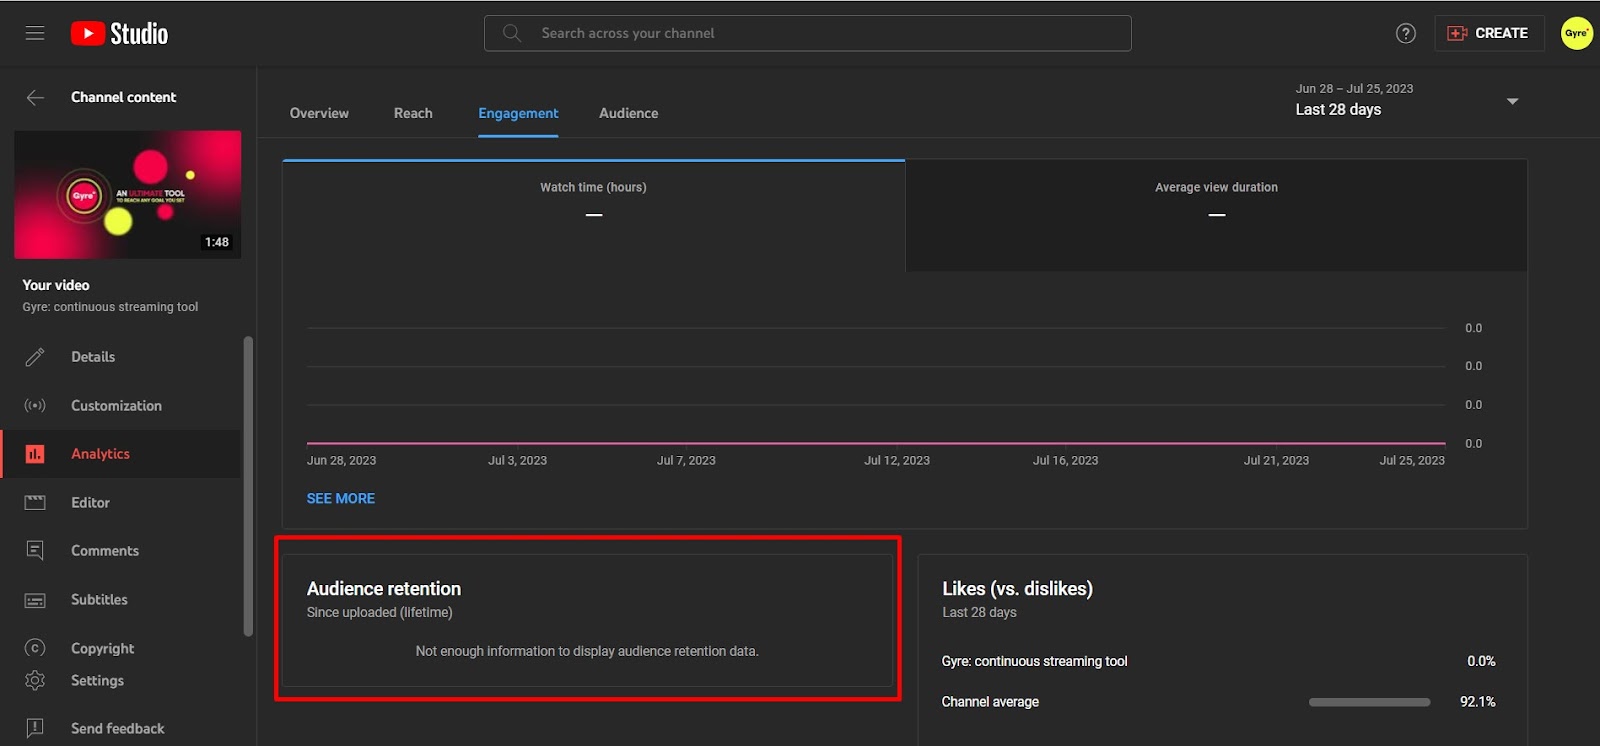
Audience Retention
The Audience Retention metric is the total number of viewers with you during the entire broadcast. High values of this indicator show that your streams are entertaining. In addition, you will be able to understand what time is best to stream and what topics are most relevant for your target audience.
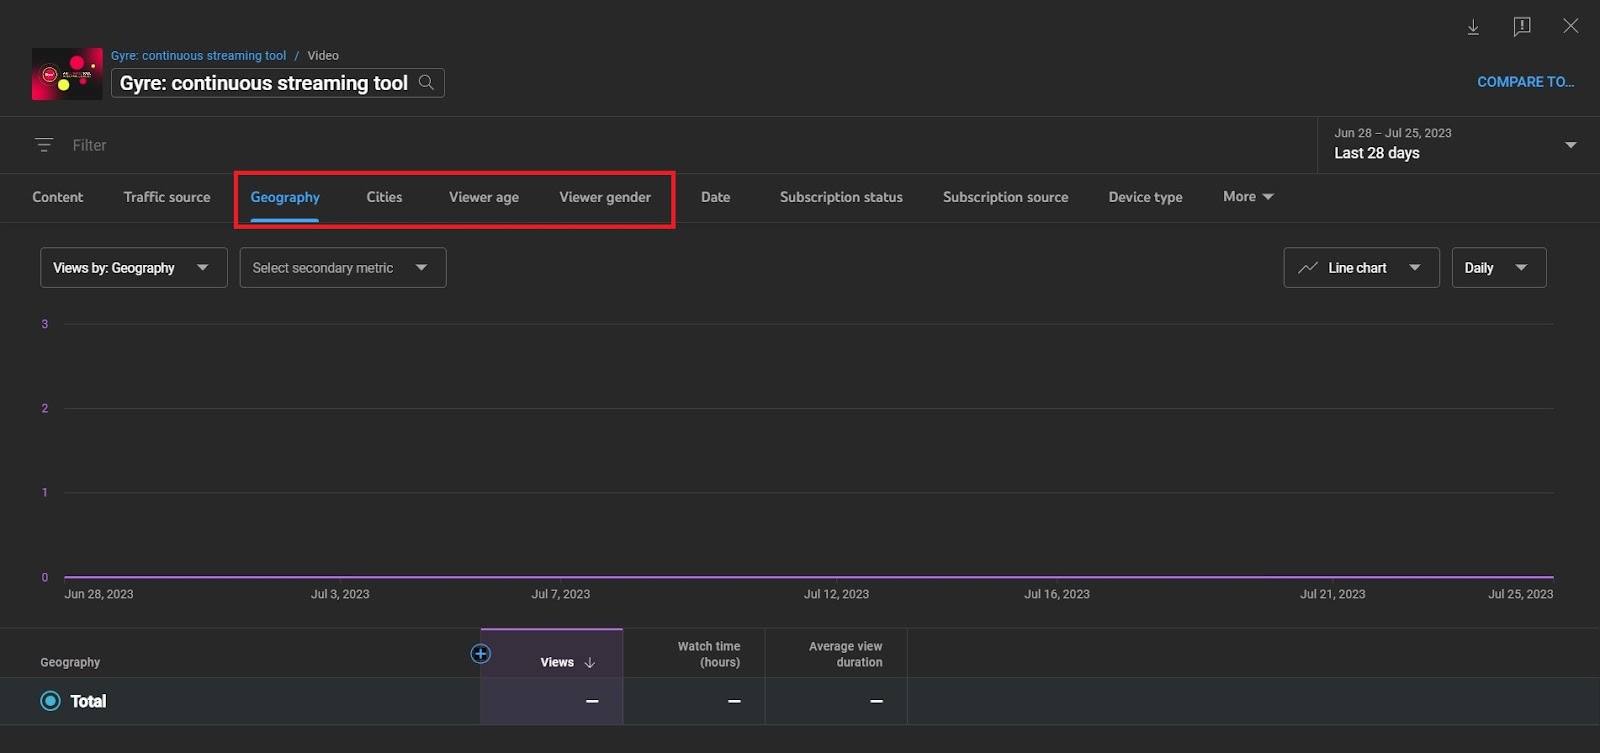
Demographics
By checking the Top Geographies and Age and Gender sections, you will be able to determine the essential demographic parameters of your audience, including age, location, gender, etc. This way, in future streams, you can consider the interests of those viewer groups that watch your streams most actively.
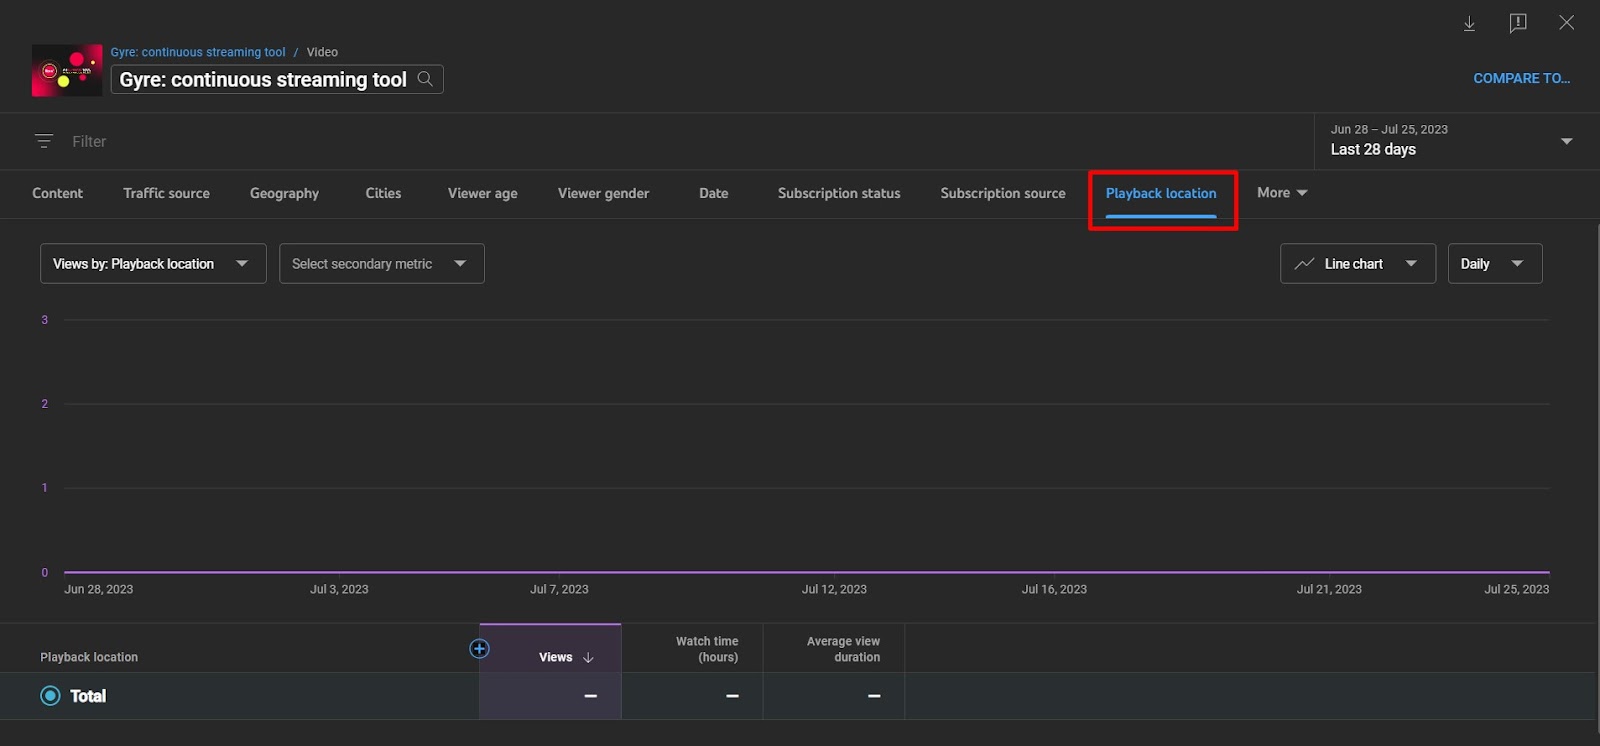
Playback Location
The Playback Location section will tell you which third-party platforms your streams have been uploaded to besides YouTube. This way, you can optimize your promotion strategy outside of YouTube.
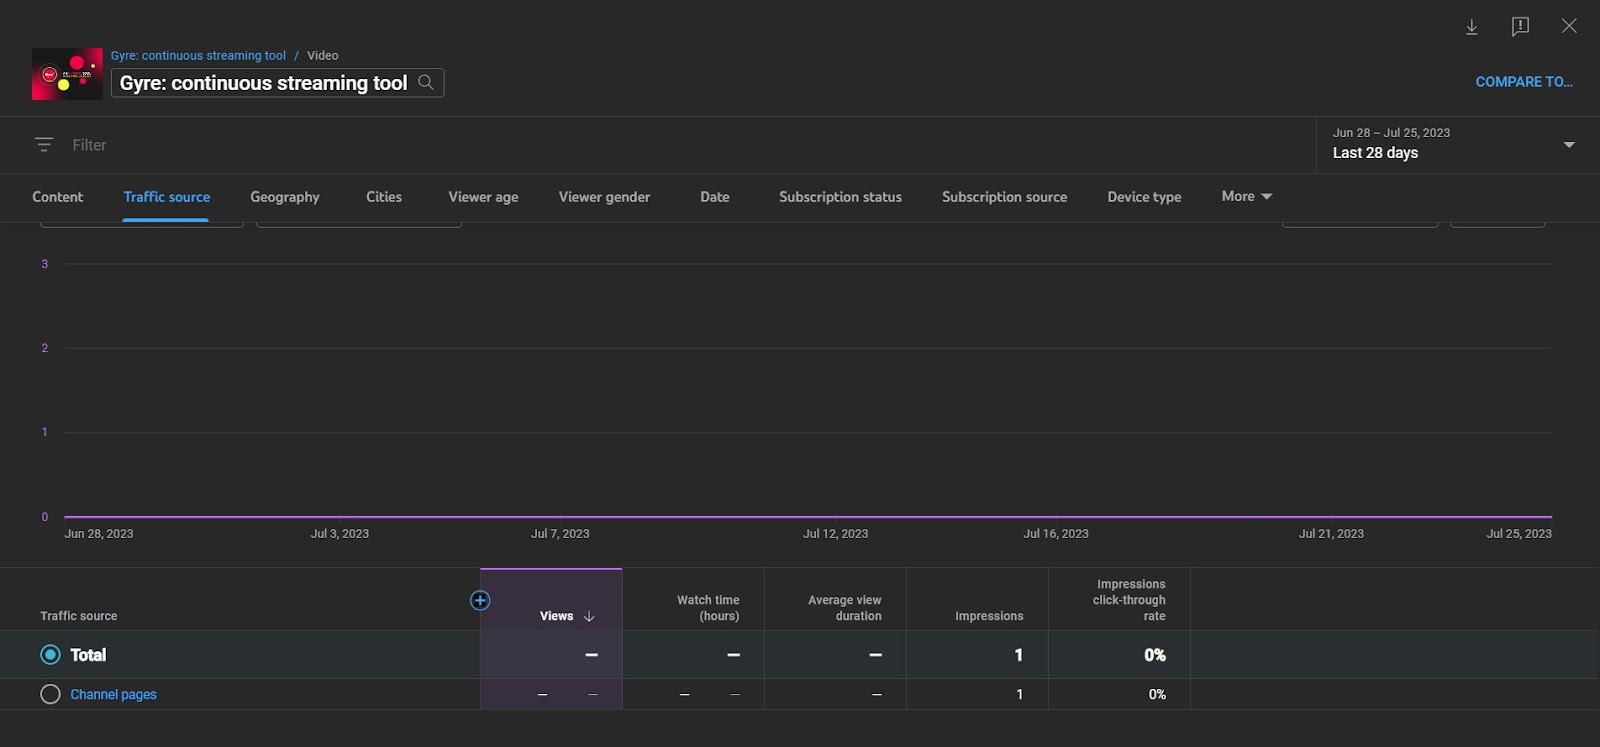
Traffic Sources
The Traffic Source section will tell you what personal devices your viewers used to watch your streams and how they found them (whether it was an offer, advertising, external links, or purposefully searching for fresh content). Understanding this information will allow you to adjust your promotion strategy on the YouTube platform and beyond.
Conclusion
Regular monitoring of the above metrics will give you a complete understanding of how engaging your content is for your target audience. Also, it will allow you to promote your channel more effectively. At the same time, it’s crucial to understand that factors such as budget and content topic play an equally important role in the formation of the values of these metrics. If you can’t achieve the desired return on your streams, optimizing these influence aspects may also be worth optimizing.