 16 min read

TL;DR
- Google Trends reports relative search interest on a 0–100 scale, not search volume. A score of 100 marks the peak for the term, region, and period you selected.
- Switching the property filter from Web Search to YouTube Search returns a separate dataset built only from queries typed inside YouTube.
- A “Breakout” label on a rising query means the term grew by more than 5,000% against the previous period, according to Google’s own Trends documentation.
- Google rebuilt the Explore page on January 14, 2026. A Gemini side panel now fills the graph with up to eight related terms, and the number of rising queries shown per timeline doubled.
- Google Trends measures demand outside YouTube. The Trends tab in YouTube Studio measures what your audience and viewers across YouTube search for, and where the existing results are weak.
- Publish while the line is still climbing. On a query that already peaked, the results ranking above you are older, longer-watched, and harder to displace.
What Google Trends actually measures
Google Trends analyzes how often people search for a term relative to everything else being searched at that moment, worldwide or down to city level. It also tracks how that interest moves over a period you choose and surfaces the queries growing fastest around it. Google describes the underlying dataset as a random sample of aggregated, anonymized, and categorized Google and YouTube searches, which is why YouTube data sits inside the same tool rather than in a separate product.
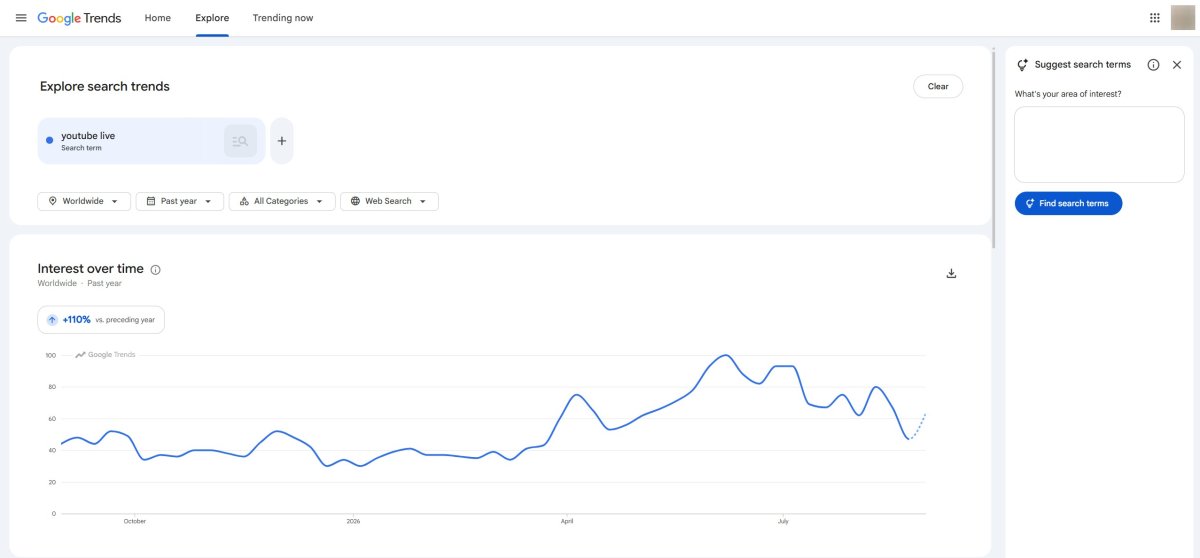
The number on the graph confuses more people than any other part of the tool. The graph reports an index, not a count. Interest is scaled to 100 at the highest point in your selected range and region, so a niche query with 900 monthly searches and a mainstream one with 9 million can both hit 100 on their own charts. That makes Trends excellent for direction and useless for absolute size, and it is why comparison mode matters more than any single line.
Here is what the Explore tool gives you:
- Interest over time, plotted as a graph for the period you set
- Regional popularity, filtered by country, subregion, or city
- Side-by-side comparison of several search terms
- Interest inside a specific category, which disambiguates terms with more than one meaning
- Related queries split into top and rising, with growth percentages
Beyond general Google search, Trends can narrow the same analysis to Google Images, Google News, Google Shopping, and, most usefully for creators, YouTube Search. All of it is free, which puts Trends in the same bracket as the other free YouTube tools worth keeping in a workflow.
What changed in Google Trends in 2026
On January 14, 2026, Google shipped a rebuilt Explore page with Gemini capabilities in a side panel. According to the announcement from the Google Trends product team, entering a subject now auto-populates the graph with up to eight related search terms instead of making you brainstorm them one at a time. The panel also proposes further angles to explore, and each term gets its own icon and color so you can match a line to a label without hovering.
Two smaller changes matter more than the AI framing. Google increased how many terms you can compare at once, and doubled the number of rising queries displayed on each timeline. For anyone building a content calendar, that second one is the real upgrade: rising queries are where new video ideas come from, and you now see roughly twice as many of them per lookup.
The redesign launched on desktop first and rolled out gradually. Country, time, and property filters all survived the rebuild, so the YouTube Search workflow below works the same way it did before.
Why a YouTube content strategy needs demand data
Publishing good videos consistently is table stakes. What separates channels that compound from channels that plateau is whether each upload lands on a topic somebody was already looking for. Trends data closes that gap in four concrete ways:
- Climbing topics surface before they saturate, which is the only window where a small channel can outrank a large one.
- Seasonality becomes visible, so you can schedule the shoot six weeks ahead of the annual spike instead of two weeks after it.
- Regional splits decide whether a video is worth subtitling, dubbing, or aiming at one market.
- Two candidate topics can be compared head to head, so the production week goes to the one with more momentum.
None of that replaces judgment about what your channel is for. It replaces the part of the decision that was previously a coin flip.
Using Google Trends for YouTube, step by step
Say you publish general educational content and you are deciding whether your next video should cover AI note-taking tools. Here is the full lookup, in the order the interface presents it.
Pick the topic
Open trends.google.com, set the country in the filter row, and enter your keyword. Choose a category at this stage if your term is ambiguous.
One distinction is worth getting right before anything else. Trends separates a search term, which is the literal string, from a topic, which is a concept Google has already grouped across spellings and languages, and for most creator research the topic gives the cleaner signal. Our roundup of the biggest videos and channels on YouTube right now is a reasonable place to collect candidate terms before you start.
Read the interest-over-time graph
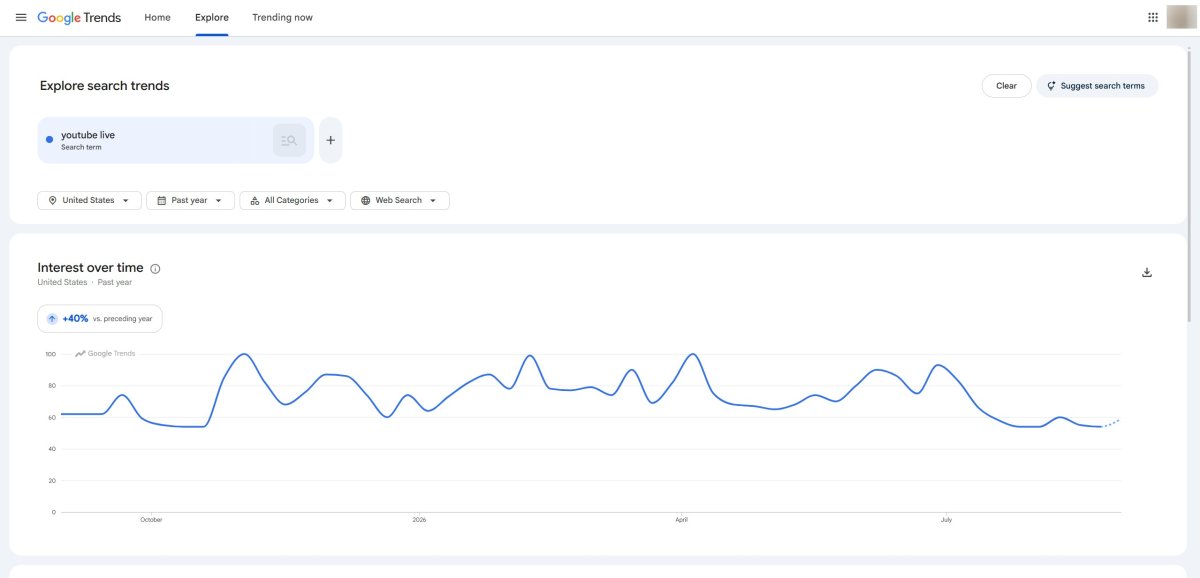
A line rising left to right means growing interest. Peaks mark maximum attention; dips mean the topic is either cooling or seasonal. Set the range deliberately, because it changes the story: 12 months exposes seasonality, five years exposes whether a topic is structurally growing, and 90 days tells you whether something is still climbing this quarter. The default range is short, and reading a 24-hour chart as if it described a trend is the single most common mistake with this tool.
Check where the interest is
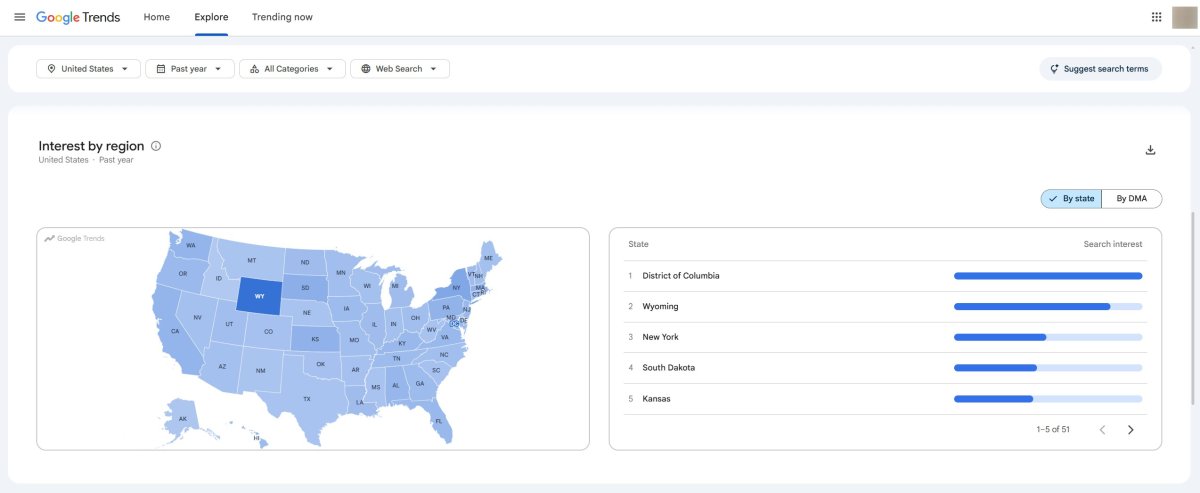
Scroll below the timeline and you get interest by subregion, ranked. Set the country filter above the graph first, and set a sensible time range while you are there. On the default short window you mostly learn which time zones are awake, not which markets care.
Top searches and rising searches
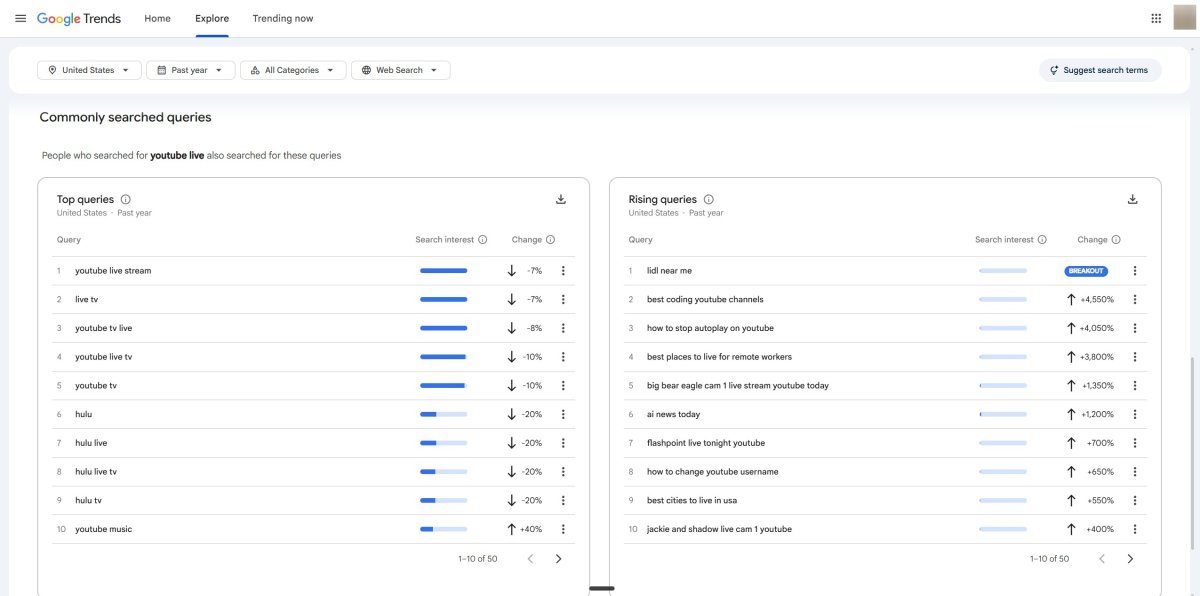
Further down sit two related-query panels. Top searches are the terms most often searched alongside yours in the same session, which tells you how the audience frames the subject. Rising searches are the terms that grew most in the period, each with a growth percentage attached, and this is where next quarter’s video titles come from.
When a rising query shows “Breakout” instead of a number, Google’s documentation defines it as growth of more than 5,000% over the previous period. That is a strong lead and a weak verdict. It also appears when a term went from almost no volume to a little volume, so open the query and look at the curve before you commit a shoot to it.
Narrow by category
Back at the top of the page, the category selector filters everything below it. Use it whenever your term carries more than one meaning, and use it again to sanity-check a topic that looks unexpectedly popular. A term that spikes in an unrelated category usually means you are reading somebody else’s trend.
Switch the property filter to YouTube Search
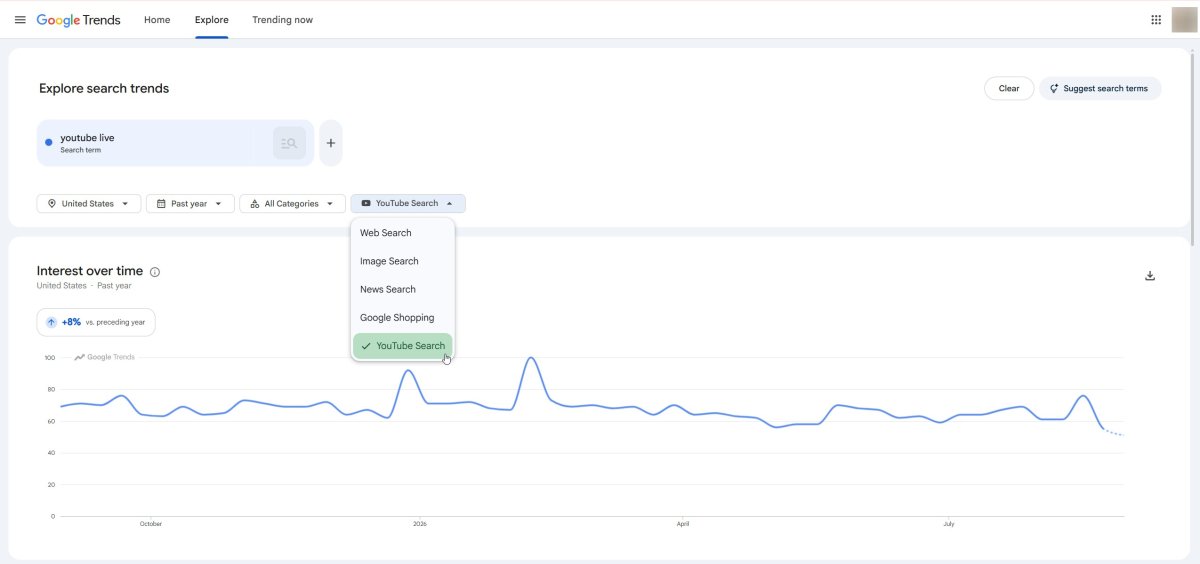
The filter to the right of the category selector controls which Google property the data comes from. Switch it from Web Search to YouTube Search and the entire page reloads against queries typed inside YouTube. Do this on every lookup. Web and YouTube intent diverge constantly, because people go to Google to read and to YouTube to watch someone do the thing.
From a rising query to a published video
The lookup above is the raw material. Turning it into a decision takes four steps, and skipping the second one is how creators end up chasing a spike that lasted nine days.
Step 1. Find the trend
Start broad. Enter the core subject of your niche, set the property to YouTube Search and the range to 12 months, then read the rising queries rather than the graph. Collect five to ten candidate terms and pull a few more from the Gemini panel suggestions.
You are building a shortlist here, not choosing from it. Keyword volume tooling can widen that list further, and our guide to promotion services and tools for YouTube channels covers what is worth paying for.
Step 2. Validate it
Put your shortlist into comparison mode, two to four terms at a time, and look at the shape of each line rather than its height. Three shapes matter.
- A steady climb over several months: a topic worth building a series around
- A single vertical spike with fast decay: news, and by the time you publish, the interest has moved on
- A repeating annual wave: seasonal, so the topic is valuable but the date is already fixed for you
Then run one more check outside the tool: search the winning term on YouTube and look at what already ranks. If the top five results are recent, thorough, and from channels much larger than yours, momentum alone will not carry you.
Step 3. Time the upload
Publish into a rising line, not a peak. Videos accumulate ranking signals over their first days, and the way the YouTube algorithm tests new uploads means the first 24 to 48 hours decide how far a video travels. Arriving before the peak means that test happens while demand is still growing. Arriving after it means competing against videos that already banked their watch time.
Timing has a second half that has nothing to do with the upload date. A trend usually stays warm for weeks after it crests, and most channels go quiet in exactly that window because the next video is still in editing. Gyre covers the gap by broadcasting pre-recorded video as a 24/7 live stream on YouTube, Twitch, and Kick, so a keyword-titled stream built from your existing library stays discoverable while the new video is being cut.
Step 4. Build the title around the query
Use the exact phrasing from the rising query in the title, in the first two lines of the description, and in the spoken opening of the video. Not a synonym, and not a cleverer version of it. Rising queries are literal strings people typed, and matching them is the cheapest relevance signal available. Tags are a distant secondary concern here, which our breakdown of what YouTube tags actually do in 2026 goes into, and the wider packaging checklist lives in our guide to optimizing a YouTube channel.
What each Google Trends feature tells you
| Feature | What it tells you | How to use it for YouTube |
|---|---|---|
| Interest over time | Relative interest indexed 0–100 across your chosen range | Decide whether to publish now, schedule for a season, or drop the idea |
| Comparison mode | Several terms plotted on one shared scale | Choose between two candidate topics with the same production cost |
| Gemini side panel | Up to eight related terms populated automatically, plus further angles | Build a competitive set in one lookup instead of five |
| Interest by subregion | Where the demand actually sits, down to city level | Decide on subtitles, dubs, and which market a video is aimed at |
| Related topics | Concepts searched alongside yours, grouped across phrasings | Map out a series or a playlist rather than a single video |
| Top searches | The most frequent co-searched terms | Learn the vocabulary your audience already uses |
| Rising searches | Terms with the sharpest growth, with a percentage or a Breakout label | Source next quarter’s titles; treat Breakout as a lead to verify |
| Category filter | The same query isolated to one subject area | Separate a genuine niche trend from a lookalike in another field |
| Property filter | Data drawn from YouTube Search instead of Web Search | Read what viewers search on the platform you publish to |
Google Trends plus YouTube Search Suggest
Trends tells you a topic is growing. It does not tell you how a viewer types it into the YouTube search bar. Autocomplete does, and the two together take about five minutes.
The workflow runs in one direction. Take a rising query from Trends, type the first two or three words of it into the YouTube search box, and record every suggestion that drops down. Those suggestions come from what people have actually searched on the platform, so they arrive already phrased the way your audience phrases things. Add a letter after the phrase and cycle through the alphabet to pull long-tail variants out of the same box.
What you get is a hierarchy rather than a keyword list. Trends supplies the demand curve and the direction of travel; autocomplete supplies the exact wording for the title, chapters, and the opening sentence. The suggestion box is also the free research method sitting underneath most sensible metadata advice.
One caution: autocomplete has no timeline. A suggestion can be popular and dying at the same time. Take the phrasing from autocomplete and the timing from Trends, never the reverse.
Google Trends or YouTube Analytics: which answers what
These two tools answer different questions, and creators lose time by expecting one of them to do the other’s job.
Google Trends is external and anonymous. It samples what everybody searches, with no reference to your channel, which makes it the right instrument for deciding what to make next and when. What it cannot tell you is whether your audience would watch the result.
YouTube Analytics is internal, and it has two layers people tend to conflate. Most tabs report your own performance: reach, engagement, audience, revenue.
The Trends tab, formerly called Research, does something else entirely. Per YouTube Help, it shows top searches from your audience over the last 28 days, breakout videos from channels similar to yours, and content gaps, meaning searches where viewers are not finding enough good results. Audience interest levels there are drawn from videos watched over 1,000 times per week.
Content gaps are the part worth building a habit around, because they identify demand that existing videos are failing to satisfy, which is a much better brief than “this topic is popular.” Note that YouTube began rolling out an updated Studio experience in July 2026, so the tab may look different from older screenshots. The rest of that dashboard is covered tab by tab in our complete guide to YouTube analytics.
A practical split: open Google Trends when you are choosing a topic, and open the Trends tab in Studio when you are choosing the angle.
Key Takeaways
- Run every candidate topic through YouTube Search before Web Search. The two datasets disagree often, and only one of them describes the platform you publish on.
- Set the time range before you read the curve. Twelve months for seasonality, five years for structural growth, 90 days for whether it is still climbing.
- Treat a Breakout label as a lead. Open the query, check the shape of the curve, and confirm the spike is not a one-week news cycle.
- Ship into a rising line. If the topic already peaked, put the next cycle in your calendar now and prepare instead of chasing.
- Pair Trends with the Trends tab in YouTube Studio once a month. External demand tells you what to make; content gaps tell you where the current results are weak enough to beat.
FAQ
How do I use Google Trends for YouTube?
Search your topic on trends.google.com, switch the property filter from Web Search to YouTube Search, and check whether interest is rising, flat, or falling. Then compare two or three candidate topics on one chart and pick the one with more momentum.
What does “breakout” mean in Google Trends?
Google applies the Breakout label to a rising query that grew more than 5,000% against the previous period, in place of a percentage. It usually signals an emerging topic worth acting on quickly, though it also appears when a term grew from a very small base.
Should I time my uploads based on Google Trends?
Yes, within reason. Publish while the line is climbing rather than after it peaks, since a video accumulates most of its ranking signals in its first days. For seasonal topics, work backward from the annual spike and schedule production so the video is live before demand arrives.
How is Google Trends different from YouTube Analytics?
Google Trends measures search interest outside your channel, across Google and YouTube, and is built for topic discovery. YouTube Analytics reports your own channel performance, plus a Trends tab covering what your audience searches for and where content gaps exist. Use the first to choose a topic and the second to choose the angle.
Does a Google Trends score of 100 mean high search volume?
No. The scale is relative: 100 marks the highest point for that term within the region and period you selected, whatever the underlying volume. A tiny niche query and a mainstream one can both read 100 on their own charts, which is why comparison mode is the only way to judge relative size.