 15 min read

TL;DR
- YouTube Analytics groups are custom collections of up to 500 videos, playlists, or channels that you compare against each other on any metric, which makes them the right tool for testing formats, thumbnail styles, or upload timing.
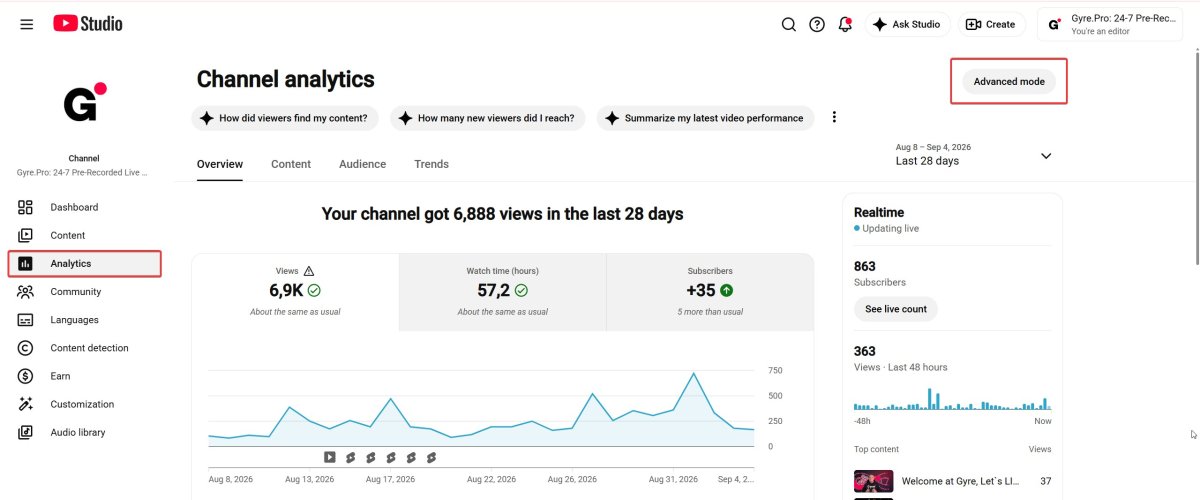
- Groups live in Advanced mode only: Studio → Analytics → ADVANCED MODE or SEE MORE → your channel name in the search bar → Groups tab.
- Build groups of 5–10 similar videos. Two or three videos produce flukes, and a group of eighty averages the signal away.
- Compare impressions click-through rate, average view duration, and watch time between groups to see which format or style earns attention.
- Groups and Test and Compare answer different questions: groups compare finished videos against each other, Test and Compare runs a live A/B test of titles and thumbnails on one video.
- Change one variable per test. Two changes at once make the result unreadable, no matter how clean the group is.
What are YouTube Analytics groups?
A group is a custom collection of your own content that Studio reports on as a single unit. Google’s API documentation puts the ceiling at 500 items per group and adds one rule that catches people out: every item has to be the same resource type. You can build a group of 100 videos or a group of 100 playlists, never a mix of both.
Groups are private. Viewers never see them, they don’t appear on your channel page, and they change nothing about how your videos are distributed. They exist purely so that Studio can add up a set of videos and show you the total.
That aggregation is what makes them a testing tool. A single video’s click-through rate tells you very little, because publishing day, topic, and traffic mix all move it. Eight videos that share one deliberate design choice, averaged together, tell you something about the choice itself.
Why testing beats guessing on YouTube
Without testing you won’t know what topics, formats, video lengths, or delivery styles your audience actually wants. Test results tell you which videos hold attention, which thumbnails and titles earn the click, which content types bring in subscribers, and which uploads are quietly dragging the channel down.
Regular testing turns content decisions into decisions based on data rather than assumption. It also compounds: every test narrows the range of things you still have to guess about, and the next test starts from a better position.
How do you create a video group in YouTube Studio?
Decide what you’re testing before you open Studio. Editing style, topic, publishing time, tone, title structure, or thumbnail treatment all work as variables, but the group only means something if every video in it shares that one trait. Once you know the variable, start tracking performance using YouTube Analytics and build the group around it.
The path itself, per YouTube’s own documentation:
- Sign in to YouTube Studio on a desktop browser. Groups are not available in the mobile app.
- From the left menu, select Analytics.
- Under any report, click ADVANCED MODE or SEE MORE. Both open the same expanded view.
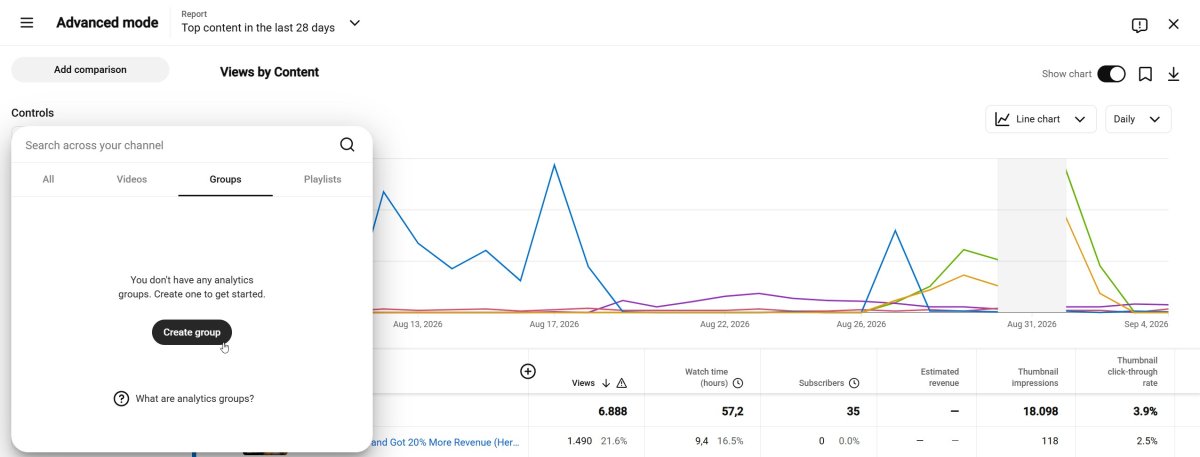
- In the top left, click your channel name in the search bar. This is the step most walkthroughs skip, and without it the Groups tab isn’t visible.
- Select the Groups tab, then Create group (labeled CREATE NEW GROUP in some views).
- Name the group, select the videos, and save.
Name groups so they describe the variable, not the content. “Faceless thumbnails” and “Face thumbnails” are useful names; “Batch 3” is not, because in six weeks you won’t remember what batch 3 was testing.
The same Groups tab is where you edit, delete, and download data for a group later, so a group you build once stays useful across months of uploads.
Setting up groups to compare videos
Start with a pair. If you make eye-catching thumbnails without faces and aren’t sure the choice is helping, one group holds the faceless thumbnails and a second holds the ones with faces. Keep both groups under the 500-video ceiling, which is generous enough that no ordinary channel will hit it.
Once both groups exist, open either one and use the comparison control in the top left. Studio then charts the two groups side by side on watch time, impressions, and every other metric available in the report.
How do you compare group performance in YouTube Analytics?
You compare through the Add comparison control in Advanced mode, which handles four distinct comparisons. YouTube’s guidance on Advanced mode lays them out:
- Two groups or playlists. The core testing comparison. Group everything shot in a new editing style, then measure that group’s audience retention against the group using the old style.
- Periods or year over year. Shows seasonal patterns and the effect of a strategy change, which matters when you’re testing publishing frequency rather than the videos themselves.
- Two videos. Useful for a post-mortem on your best and worst performer in one series, where the difference in click-through rate, retention, and traffic sources explains what happened.
- The 24-hour, 7-day, or 28-day lifespan report. This one compares videos at the same point in their life instead of at the same date, which removes the unfair advantage older uploads have simply from being around longer. For a thumbnail test, the first 7 days is usually the honest window.
The lifespan comparison is the piece most testing workflows miss. A video published in March has had months to accumulate watch time, so comparing its lifetime totals against a video from last week says nothing about which one is better packaged.
Pick the metric that matches the variable you changed. Testing packaging and reading watch time will give you a real number attached to the wrong question. This table maps common tests to the metric that answers them, and there’s more on how the metrics interact in our complete guide to YouTube analytics.
| What you’re testing | Metric to compare | What a gap between groups tells you |
|---|---|---|
| Thumbnail style, for example faces against no faces | Impressions click-through rate | Which packaging earns the click before anyone has watched a second |
| Intro length, hook at 0:00 against a slow build | Audience retention across the first 30 seconds | Whether the opening loses viewers before the content starts |
| Video length, under 10 minutes against over 10 | Average view duration and total watch time | Whether the longer cut holds attention or just adds runtime |
| Topic cluster, tutorials against commentary | Subscribers gained | Which pillar converts browsers into subscribers |
| Format, regular uploads against saved live archives | Watch time and impressions | Which format YouTube distributes more widely on your channel |
| Publishing window, weekday against weekend | Impressions in the first 24 hours | Whether the schedule rather than the content is capping early reach |
Where Test and Compare fits in
Groups and Test and Compare solve different halves of the same problem, and running both is what makes a testing workflow complete. One looks backward at videos that are already published and asks which set performed better. Test and Compare looks forward and runs a live experiment on a single video, showing up to three title or thumbnail variants to real viewers at the same time.
The eligibility rules for the A/B tool are narrower than for groups. YouTube’s documentation restricts it to desktop Studio, requires advanced features on your account, and excludes Shorts, scheduled lives, Premieres that haven’t converted yet, private videos, and anything marked made for kids or for mature audiences. Live archives are eligible. Tests finish within two weeks, and the winner is decided by watch time, not by click-through rate.
A sensible sequence runs in one direction. Use groups to find the pattern, then use Test and Compare to confirm it on a specific video. If your faceless-thumbnail group consistently trails on click-through rate, that’s a hypothesis, not a verdict; an A/B test on one video with a face and one without turns it into a verdict. Our walkthrough of YouTube’s title and thumbnail A/B testing tool covers setup and how to read an inconclusive result.
A testing methodology that produces usable answers
The methodology is simpler than the tooling. Pick one variable, build two groups that differ only on that variable, give both groups enough videos to average out noise, and read a metric that the variable could plausibly move.
On group size, 5–10 videos per group is the practical range. This isn’t a platform rule, it’s arithmetic: below five, one unusual upload swings the average hard enough to invent a result; above ten or so, you start folding in videos from different periods and different topics, and the shared variable stops being the thing the two groups differ on. Five has always been the sensible floor, and the ceiling matters just as much.
Three tests worth running first, because each one changes something cheap:
- Thumbnail style. Group by treatment, not by topic: text overlay against no text, or face against object. Read impressions click-through rate over the first 7 days of each video’s life. The specific design choices worth varying are covered in our guide to getting a high CTR from thumbnails and descriptions.
- Intro length. Group the uploads that open on the payoff against the ones that open on a setup. Read retention in the first 30 seconds. For most channels this is the largest retention gap available to close.
- Video length. Group under and over your current average. Read average view duration alongside total watch time, because a longer video can win on total minutes while losing badly on the percentage watched.
Channels running a 24/7 stream of pre-recorded video through Gyre on YouTube, Twitch, and Kick end up with a second content type sitting in the same Analytics account: the saved archives those broadcasts leave behind. Archives are ordinary long-form videos as far as Studio is concerned, so they group and compare exactly like uploads, and putting them in their own group answers a question most channels never get to test — whether continuous broadcasting or scheduled uploads earns more watch time on that particular audience.
How do you export group data?
Studio’s charts are enough for a two-group comparison. Past that, export the data. In Advanced mode, adjust the report to the groups, metrics, and date range you want, then use Export current view and pick a file format.
Two limits shape what’s possible. A downloaded report caps at 500 rows, and anything larger needs the YouTube Reporting API. Studio also holds up to 50 saved reports, which is worth using: save the group comparison you check monthly and it reopens with your filters and dimensions already applied instead of being rebuilt each time.
Exports matter for tests that run across many videos, where you want to sort, filter, and calculate outside Studio’s chart view. A spreadsheet of variant, group, impressions, click-through rate, and average view duration becomes a record of what your audience has already told you, and that record is what stops you from running the same test twice.
Testing ideas to improve your content strategy
If you’re not sure what to test first, these questions each map cleanly onto a pair of groups:
- Does a face in the thumbnail change click-through rate on your channel?
- What video length produces the best retention for your topics?
- What day or time of day earns the most impressions in the first 24 hours?
- Which delivery format holds attention: conversational, narrative, or instructional?
- Which topics reliably generate comments?
YouTube’s own suggestions point at the same three axes. Group across content pillars to see how one subject performs against another, group across content style to isolate an editing or tone choice, and group across length to compare your short uploads with your long ones.
Favor variables that are cheap to change: intro, editing style, video structure, posting cadence. Anything that requires reshooting is a poor first test. Pairing that habit with trend data will help you build a sustainable content strategy rather than a backlog of one-off experiments.
Common mistakes when testing videos
Testing looks simple, and most creators still get nothing out of it. Four failure modes account for almost all of it.
- Groups that are too small. Two to four videos per group is not a test, it’s a coincidence with a chart attached. Five is the floor.
- Ignoring timing and seasonality. A group published during a topic’s peak season will beat a group published in its dead months regardless of what you were testing. Use the lifespan comparison, or keep both groups inside the same period.
- Reading results too early. Give the data at least two weeks. Weekday and weekend audiences behave differently, and a three-day read can crown a winner that only suits Tuesday afternoon viewers.
- Changing more than one thing. A new thumbnail style plus a new intro structure produces a number you cannot attribute. One variable per test, always.
One more that shows up on established channels: never setting a threshold in advance. Decide before you look what size of gap would actually change your next upload. Without that number, a 0.3% difference in click-through rate turns into a strategy pivot it doesn’t deserve.
Key Takeaways
Open Studio and build your first pair of groups this week. Pick the variable you argue about most on your channel, whether that’s thumbnail treatment, intro length, or upload day, and split your last twenty or so uploads into two groups of 5–10 along that line.
Compare them on the lifespan report rather than on lifetime totals, so older videos don’t win on age alone. Note the gap, and note the threshold that would make you change something.
Then take the pattern to Test and Compare and confirm it on one video before you rebuild anything. Groups tell you where to look; the A/B test tells you whether you’re right. Rerun the same comparison each quarter, because audience behavior shifts and last year’s answer expires quietly.
FAQ
How do I create a video group in YouTube Analytics?
Go to YouTube Studio → Analytics → ADVANCED MODE or SEE MORE, then click your channel name in the search bar at the top left. Select the Groups tab, choose Create group, name it, pick your videos, and save. The group then appears as a selectable unit in every Analytics report.
How many videos should be in a group?
Five to ten similar videos per group works best in practice. Fewer than five lets a single unusual upload decide the result, and much more than ten mixes in videos that no longer share the trait you’re testing.
What should I compare using groups?
The most useful comparisons are thumbnail style, intro length, video length, and topic cluster. Match the metric to the variable: click-through rate for packaging, retention for pacing, average view duration for length, and subscribers gained for topic.
Can I use groups together with Test and Compare?
Yes, and they work best in sequence. Groups compare finished videos against each other to surface a pattern, while Test and Compare runs a live A/B test of up to three titles or thumbnails on a single video. Use groups to form the hypothesis and Test and Compare to confirm it.
Can I export group data out of YouTube Studio?
Yes. In Advanced mode, set up the report you want and click Export current view. Downloads are capped at 500 rows, so larger pulls need the YouTube Reporting API instead.
Do viewers see the groups I create?
No. They exist only inside your Studio account, never surface on your channel page, and have no effect on how your videos are recommended or distributed.