 13 min read

TL;DR
- Audience retention is the share of a video the average viewer watches. Average view duration (AVD) is the same data in minutes and seconds instead of a percentage, and YouTube Studio reports both.
- YouTube publishes no universal target. Analytics compares each video against your typical retention: the last 10 uploads of similar length on your own channel.
- As a market reference, a 2025 benchmark study of more than 10,000 videos put average YouTube retention near 23.7%, with only 16.8% of videos holding past 50%.
- The steepest drop happens in the first 30 seconds, the exact window YouTube labels “Intro” in the key moments report.
- After the hook, pacing carries the curve: J-cuts, L-cuts, b-roll in dense stretches, and chapters that let viewers jump to what they came for instead of closing the tab.
- Shorts retention is measured separately from long-form and feeds a separate route into the YouTube Partner Program.
Why audience retention unlocks YouTube growth
You may think views are everything, but if you’re serious about YouTube growth, one metric matters more: audience retention.
Audience retention shows how long viewers stay on your video before clicking away. YouTube calculates the rate by dividing the average watch time by the total video length and multiplying by 100. If your 10-minute video has an average view duration of 5 minutes, your average percentage viewed is 50%.
The two numbers people mix up are the same measurement in different units. In YouTube’s own definitions, average view duration is the average minutes watched among those who stayed to watch, and average percentage viewed is that same watch time as a share of the runtime. A 40-minute interview can beat a 4-minute explainer on AVD while losing badly on percentage, which is why the algorithm reads them together rather than one at a time.
Good retention tells YouTube that your video is worth pushing. That means better video performance, more recommendations, more watch time, and more growth.
What it does not mean is a fixed number to chase. A 2025 benchmark report from the retention analytics tool Retention Rabbit, built on more than 10,000 videos across 1,000-plus channels, put the platform-wide average at 23.7% and found that only 16.8% of videos hold more than half their audience. The sample skews toward early and mid-stage creators, so read it as market context rather than as your target.
The hook-deliver loop: how to keep viewers engaged beyond the intro
Most creators focus on the opening hook. But holding attention on YouTube takes more than a strong start. It takes a loop.
- Hook the viewer with something unexpected or intriguing.
- Deliver value quickly.
- Repeat with another hook to keep them watching.
This loop prevents the viewer drop-off that usually lands a few minutes in. Instead of dumping all your value upfront, pace it like breadcrumbs that guide viewers through the whole video. The natural places to drop a new hook are the seams: transitions, section changes, the moment right after you finish an idea and before you start the next one.
Turn content into an experience: make viewers feel they belong
Facts are easy to find. What keeps people watching is how your video feels. To increase viewer retention, make your audience feel part of something instead of watching from the outside.
- Inclusion: speak directly to the viewer. Use “you” instead of “everyone.” Make it personal.
- Immersion: drop them straight into the action. Start with movement, action, or surprise, and explain later.
Instead of saying “Hi guys, today we’re making cookies,” start with “Sift the flour into the bowl. This is the secret to chewy cookies.” One version asks for patience, the other gives the viewer a reason to stay in the first three seconds. Treat every video as a shared experience and the engagement follows from it.
Why the first 30 seconds decide your video’s success
The first 30 seconds are make-or-break. Most retention graphs show a sharp drop right at the start, and once people bounce early they’re gone. In that window viewers are asking themselves three questions:
- Does this video match the title and thumbnail?
- Is this what I expected?
- Do I trust this creator to give me value?
You have to answer yes to all three, fast. Here’s how to win those seconds:
- Start with a pattern interrupt: a bold visual, a sound, an unexpected statement.
- Get to the point immediately. Skip long intros and backstories.
- Show, don’t tell. Demonstrate the value visually before you explain it.
Those three steps have a name: pattern interrupt, promise, payoff. First you break the viewer’s expectation with something they didn’t expect to see at that second. Then you promise something specific, not “an amazing video” but a concrete result they walk away with. Finally you deliver a fast piece of proof before any long explanation.
A recipe video that opens on the finished dish, says “four minutes, no oven,” and cuts straight to the batter holds far more people than one that opens with a greeting.
Retention editing techniques: J-cuts, L-cuts, and b-roll pacing
After the hook, the edit is what holds the curve. Three techniques do most of the work:
- J-cut: the audio from the next scene starts before the picture changes. The viewer hears something new while still looking at the previous shot, which creates curiosity and hides the cut.
- L-cut: the reverse. Audio from the current scene keeps running over the next shot, so the sentence stays continuous while the visual has already moved on.
- B-roll pacing: swapping the main shot for supporting footage every few seconds through dense stretches, so nobody spends two minutes watching a static talking head.
In practice: in an explainer, instead of cutting hard from “and after that” to the next scene, let the voice continue over the new shot while you show the result you’re describing. That removes the micro-silences where viewers tend to leave.
Chapters belong to the same logic. They don’t change the edit, but they change where attention lands inside the video, because someone who came for one specific part can jump straight to it instead of leaving to look for it elsewhere.
| Retention drop type | Likely cause | How to fix |
|---|---|---|
| Sharp drop in the first 30 seconds | Slow intro or weak hook; the thumbnail and title promise something the video takes too long to deliver | Apply pattern interrupt, promise, payoff. Cut the intro and open on the action |
| Gradual, steady decline across the video | Monotonous pacing, no visual variation, long stretches without b-roll | Add J-cuts and L-cuts, and change the shot every few seconds in the denser sections |
| Drop concentrated at one point | A confusing passage, a long tangent, or a pause with nothing in it | Review that single stretch on the curve and cut or restructure only that part |
| Spike, where the curve goes up | A moment viewers rewound to watch again, or a section they had to rewatch to understand | Work out which of the two it was, then repeat the pattern or rewrite the explanation |
How to read the retention curve in YouTube Analytics
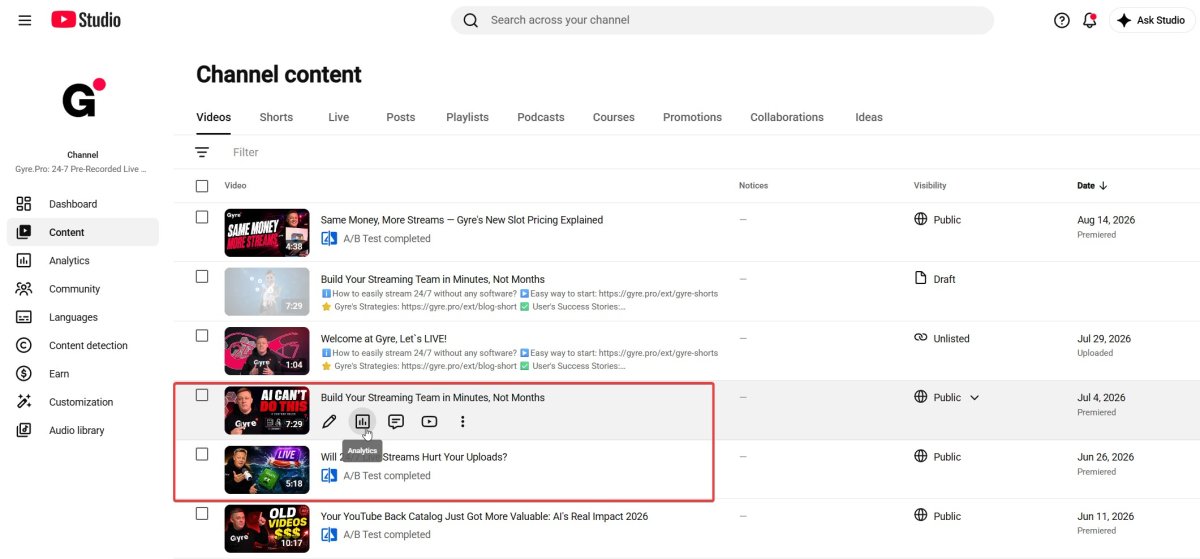
All of this only works if you can read the data. In YouTube Studio, open Content from the left menu, select Analytics on the video you want, and switch to the Overview or Engagement tab. The audience retention report lives there, at the video level only: there is no channel-wide version of this curve.
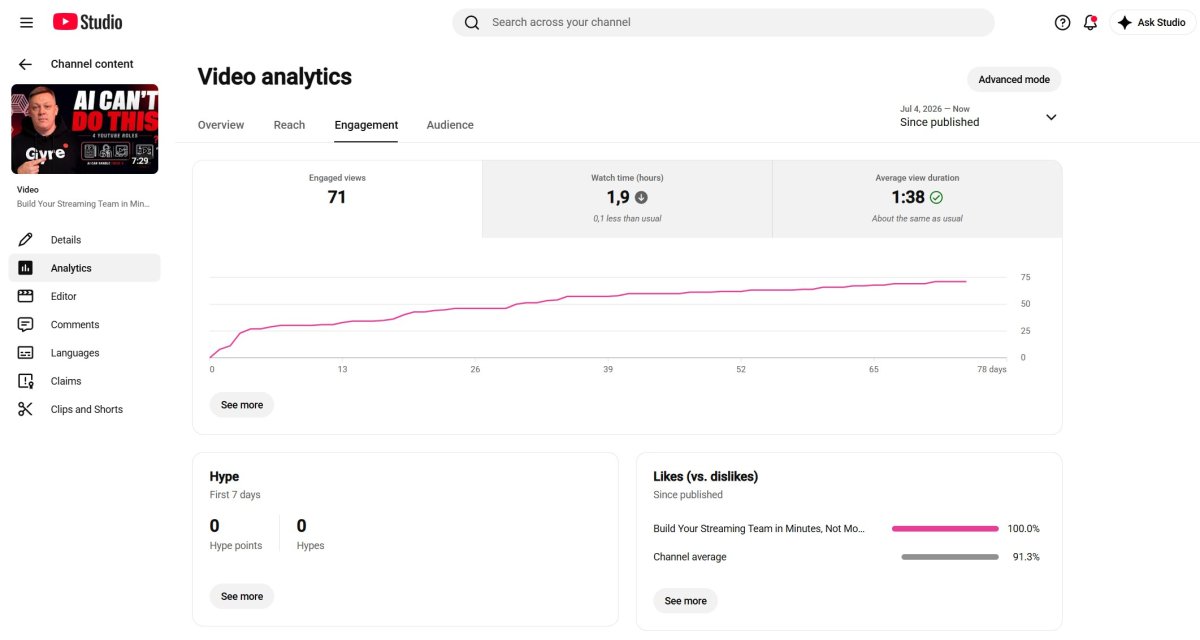
The Engagement tab opens with watch time in hours and average view duration, both compared against the channel’s usual performance. Scroll down and you reach the block that matters: Audience retention, with average view duration and average percentage viewed for this specific video.
Below it sits the key moments for audience retention report, which labels four things on the curve. Intro is the percentage still watching after the first 30 seconds, top moments are stretches where almost nobody dropped off, spikes are parts that were rewatched or shared, and dips are where viewers skipped ahead or quit.
A player above the graph shows the clip for whichever moment you select, so you can watch back the exact seconds that lost people. Spikes are the one label worth reading twice: a rewatched moment can mean the segment was good, or it can mean nobody understood it the first time.
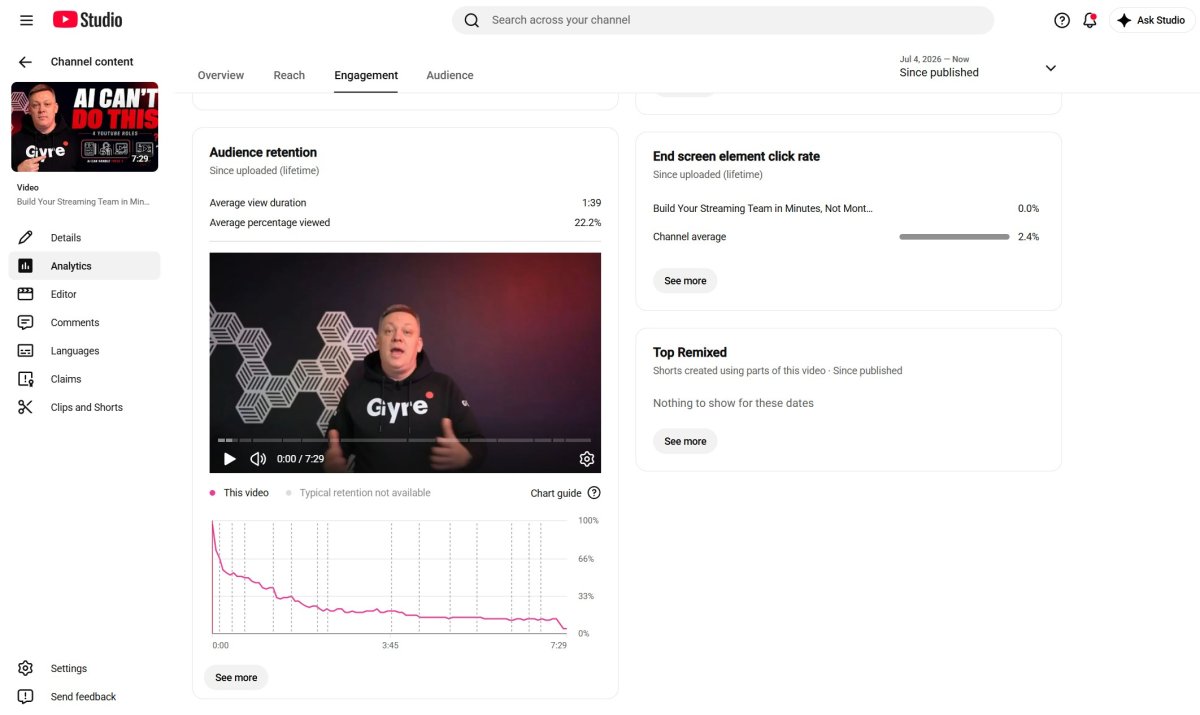
The gray band running behind your curve is your typical retention: the engagement your last 10 videos of similar length held. Above the band means this one is working better than your usual; below means it isn’t, and the shape tells you where. For the rest of the dashboard, our complete guide to YouTube analytics covers every tab and what to do with it.
None of this makes retention the only variable. The algorithm also weighs absolute watch time across the channel, not just the percentage each video holds on its own. That’s where continuous broadcasts come in: a 24/7 stream of pre-recorded video, the kind Gyre runs, accumulates channel watch time between uploads without asking you to record anything new, which keeps the channel active while you work on retention video by video.
What’s different about retention in 2026
Shorts and long-form no longer sit in the same report. Shorts have their own analytics, where the metric closest to retention is the share of viewers who stayed past the opening seconds instead of swiping away. The split runs all the way to monetization: YouTube Partner Program eligibility takes either 1,000 subscribers with 4,000 qualified watch hours in 12 months, or 1,000 subscribers with 10 million qualified Shorts views in 90 days, and watch hours from the Shorts feed don’t count toward the 4,000.
The view counter changed too. The same documentation notes that since August 24, 2026, a view is registered the moment a video starts to play, across Shorts, long-form, and live streams alike. Partner Program earnings and eligibility still run on engaged views and engaged watch hours, so the headline number now moves for reasons that have nothing to do with whether anyone watched. Retention is the metric that didn’t change, which makes it the honest one to judge a video by.
The last shift is the AI layer that now sits between a viewer and your video. In his 2026 letter, YouTube’s CEO reported that more than 20 million people used the Ask tool in December alone to find out what a video covers, and that the platform is actively reducing the spread of low-quality, repetitive content. More viewers now arrive having already been told what your video contains, which raises the price of an opening that takes 40 seconds to get to the point.
Key Takeaways
- The first 30 seconds determine whether YouTube recommends your video. The hook is critical, and pattern interrupt, promise, payoff is the structure that makes it repeatable.
- YouTube weighs absolute watch time, not only percentage: a 10-minute video watched to 70% can outperform a 2-minute video watched to the end.
- J-cuts and L-cuts hold pacing and reduce drop-off points on the curve; chapters change where attention lands inside the video.
- Removing dead air and slow intros lifts AVD without changing a single thing about the content itself.
- The retention curve shows exactly where viewers leave. Open the Engagement tab and diagnose from the shape, one video at a time.
FAQ
What is a good audience retention rate on YouTube?
YouTube doesn’t publish one. Analytics compares each video against your typical retention, meaning your last 10 uploads of similar length, and a video keeping 50% or more past the 30-second mark counts as an above-typical intro in its own documentation. For market context, the 2025 Retention Rabbit benchmark puts the platform-wide average at 23.7%, with 16.8% of videos clearing 50%.
Why do viewers leave my video early?
Usually a slow intro, a missing hook, or a mismatch between what the thumbnail and title promised and what the first seconds deliver. Opening with pattern interrupt, promise, payoff closes most of that gap.
How do I read the retention curve?
Open the video in Studio, click Analytics, and go to the Engagement tab. Scroll to Audience retention and the key moments report: the curve runs second by second, the gray band behind it is your channel’s typical retention, and the Intro, Top moments, Spikes, and Dips labels tell you which stretches to look at first.
How do I fix a steep drop in the first 30 seconds?
Watch those seconds back in the key moments player and find the exact second people leave. Cut everything before the first real piece of content, replace it with proof that the thumbnail was honest, and move the setup to after the payoff rather than before it.
Do Shorts count toward channel retention?
Yes, but Shorts retention is measured separately, as the share of viewers who watch past the opening seconds instead of swiping away. Shorts feed watch hours don’t count toward the 4,000 hours the Partner Program requires from long-form content; that route needs 10 million qualified Shorts views in 90 days instead.