
TL;DR: YouTube analytics in 5 points
- Watch time and impressions click-through rate are the two metrics YouTube's algorithm weights most heavily.
- Audience retention is what YouTube uses to judge whether your video is worth recommending; the platform recommends comparing each video against your own last 10 uploads of similar length.
- Traffic source "Browse features" means YouTube is actively pushing your content from the home feed, which is a green light for growth.
- Low CTR + high retention = fix your thumbnails. High CTR + low retention = fix your content.
- The Revenue tab only appears after you join the YouTube Partner Program (YPP) and have at least one monetized video.
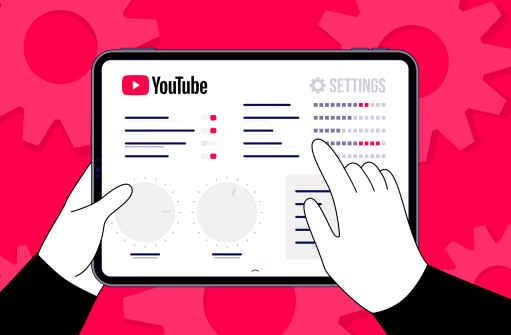
Why YouTube analytics matters for every creator
Algorithms evolve, trends shift, and formats change. One thing stays constant: data tells the truth about your content. Understanding YouTube analytics helps you:
- Track what keeps viewers engaged (watch time, retention curve).
- Measure how people find your videos through YouTube search and other traffic sources.
- See which content drives subscriptions and revenue (RPM and CPM live inside the Revenue tab).
- Get AI-generated recommendations on what to do next via Ask Studio, the AI assistant Neal Mohan highlighted in his 2026 letter as part of YouTube's creator AI rollout.
When you check YouTube Studio analytics regularly, you spot which content attracts loyal viewers and where the dashboard is telling you to course-correct before reach starts to slip.
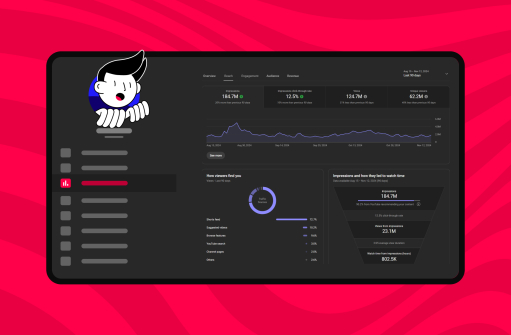
Key YouTube analytics metrics every creator should know
YouTube Studio organizes data into Reach, Engagement, Audience, and Revenue tabs. These are the pillar metrics across them:
1. Watch time and audience retention
- Watch time and average view duration (AVD) live in the Engagement tab. The retention curve shows exactly how well different moments of your video held viewer attention.
- YouTube's documentation recommends using the "typical retention" comparison, which benchmarks your video against your last 10 uploads of similar length, rather than chasing a single platform-wide number.
- Learn more about audience retention.
2. Views, impressions, and click-through rate
- Views show raw consumption, while impressions count how often your thumbnail was shown across Home, Search, Suggested, and Browse feeds.
- Impressions click-through rate links the two: how often viewers actually clicked after seeing the thumbnail. High impressions but low CTR usually points to your thumbnails or titles needing work.
3. Audience insights and demographics
- Unique viewers, returning vs. new (YouTube segments channel impressions by these two groups), age and gender splits, top geographies.
- Audience demographics tell you who is actually watching, which often differs from who you think you're making content for.
4. Subscriber growth
- Tracks how many viewers commit long-term.
- Sudden spikes or drops point directly to specific content shifts. Match them to your upload calendar.
5. Revenue metrics: RPM, CPM, and beyond
- Inside the YouTube video analytics revenue tab you'll find RPM (revenue per mille, what you actually earn per 1,000 views after YouTube's share) and CPM (what advertisers pay per 1,000 ad impressions before the split).
- The tab also covers memberships, Super Chats, Shorts ad-share payouts, and end screen CTR for monetized links.
AI-generated insights in YouTube Studio: what Ask Studio actually shows
YouTube began rolling out AI-driven recommendations inside Studio in late 2024, and by 2026 the Ask Studio assistant is available to a wide range of creators. According to Neal Mohan's 2026 annual letter, more than one million channels used YouTube's AI creation tools daily in December 2025.
What Ask Studio surfaces in practice:
- Performance deltas in natural language. Ask "what changed on my channel in the last 7 days?" and the assistant pulls relevant retention, CTR, and traffic-source data into a single answer instead of forcing you to open five reports.
- Underperformance diagnosis. Ask "why did this video underperform?" and it cross-references the video against your channel's typical retention, CTR, and traffic mix to flag what looks off.
- Idea validation via the Inspiration tab. The refreshed Inspiration tab generates AI ideas with audience data behind each suggestion, which turns the recommendation algorithm's understanding of your audience into creator guidance.
How to act on it: treat Ask Studio as a starting point, not the verdict. The AI flags patterns; you decide which one to investigate. Pair its summaries with the raw retention curve and traffic-source breakdown before changing creative direction.
Comparison table: metric, what it means, good benchmark, how to improve
Use this table as a reference when you open YouTube Studio. Each benchmark is sourced; treat the numbers as orientation, not absolute targets, since CTR and retention vary by niche, length, and traffic source.
| Metric | What it means | Good benchmark | How to improve |
|---|---|---|---|
| Impressions CTR | How often viewers clicked after seeing your thumbnail in feeds, search, or suggested | YouTube has stated half of all channels fall between 2–10%, per vidIQ; 4–6% is a common healthy midpoint | Rework thumbnails and titles for clarity and curiosity; test variants natively in YouTube Studio |
| Average view duration (long-form) | Average seconds viewers watched before leaving | Wistia's 2025 State of Video reports ~46% engagement on 1–3 min videos and ~45% on 3–5 min, with instructional 3–5 min content reaching ~74% | Tighten the first 30 seconds, cut filler, add pattern interrupts at known drop-off points |
| Audience retention curve | Shape of viewer drop-off across the video | YouTube recommends comparing each video to your own "typical retention" for the last 10 videos of similar length, not a fixed percentage | Strengthen the hook in the first 3 seconds; rebuild pacing around the dip moments YouTube labels in the report |
| Shorts feed retention | Percentage of viewers who stayed past the opening seconds of a Short | Read in combination with the Shown in Feed chart in the dedicated Shorts report | Front-load value in the first 1–2 seconds; remove any setup before the payoff |
| Browse features traffic | Share of views coming from Home and Subscriptions feeds | A rising share means the algorithm is actively pushing the video | Keep retention high; Browse exposure scales with audience satisfaction |
| End screen CTR | Click rate on links and recommended videos at the end of the video | Compare against your own channel's average; performance varies by length and topic | Use end screen elements that match the topic viewers already engaged with rather than generic "next video" funnels |
Industry benchmarks: what major video studies show
YouTube does not publish a single platform-wide "good number," but major industry studies converge on practical ranges. Use them as orientation rather than targets.
CTR by niche (vidIQ user-base patterns)
vidIQ reports that YouTube has confirmed half of all channels see CTR between 2 and 10 percent, with the range depending heavily on channel size and traffic source. Smaller channels often sit at the higher end because most impressions come from existing subscribers, while channels reaching cold home-feed audiences typically see lower CTR. Niche patterns commonly reported by creator-analytics tools:
- Educational content: roughly 4–8%, since searchers arrive with specific intent
- Gaming: roughly 3–7%, driven heavily by thumbnail design
- Tech reviews: roughly 5–10%, reflecting high-intent viewers
- Entertainment and vlogs: roughly 2–5%, mostly from casual browse traffic
Retention and AVD by video length (Wistia State of Video)
Wistia's 2025 State of Video Report, based on 14 million videos from 100,000 businesses, reports engagement rate (the average percentage of a video viewers watch) by length:
- Under 1 minute: around 50% average engagement
- 1–3 minutes: around 46%
- 3–5 minutes: around 45% across all videos, but around 74% specifically for instructional content
- 30+ minutes: lower percentage, but significantly higher total watch time
The same report flags that 2024 saw the largest engagement drop in four years (about 7% overall, and 10% for short-form 3–5 minute videos), which suggests that opening seconds matter more than ever.
Platform-wide view and engagement shifts (Metricool 2026)
The Metricool Social Media Study, covering more than 82,000 accounts and 7.3 million videos, found average views per video rose 76% year over year (from 390 to 687), driven primarily by the explosion of Shorts and connected-TV viewing. At the same time, the overall engagement rate dropped 37%, from 3.73% to 2.34%. The implication: reach is up, but a much larger share of viewers is passive, which raises the bar for hooks and retention.
What's new in YouTube analytics
YouTube has upgraded its tools to give creators deeper, faster insights:
- Ask Studio AI recommendations panel. First rolled out in late 2024 and now widely available, the assistant surfaces real-time analytics insights inside YouTube Studio in natural language.
- Dedicated Shorts analytics tab. Shorts metrics now have their own report inside Content, separate from long-form data so benchmarks don't get muddied. The Shorts report covers Shorts feed traffic, the "view vs. swipe away" split, and the Shown in Feed chart.
- "Shown in Feed" metric for Shorts. Available at Studio → Analytics → Content → Shorts → Shown in Feed chart. It counts how many times your Short appeared in the Shorts feed and is the discovery-side counterpart to standard impressions for long-form video. Compare Shown in Feed against your view count to see whether your Shorts are getting tested but not converting (a feed-side issue) or simply not being shown (a packaging-side issue).
- 200 billion daily Shorts views. The official 2026 YouTube letter confirms the scale, which is why the format now warrants its own analytics workflow rather than long-form benchmarking.
- Connected TV as a primary surface. Nielsen ranked YouTube #1 in U.S. streaming TV viewership every month of 2025, which is why the Audience tab's device split (TV vs. mobile vs. desktop) matters more in 2026.
- Cross-platform integration with Google Analytics. Channels driving traffic to a website should pair YouTube Studio data with Google Analytics referral reports to see what actually converts beyond the video itself.
For more on how the algorithm processes these signals, read how the YouTube algorithm works. For YouTube's official guidance on creator best practices, the Creator Academy remains the canonical reference.
How to use YouTube analytics to grow your channel
Analytics is only useful when you act on it. Here's how to turn each tab into a decision:
1. Refine video strategy
Study top-performing content in the Content tab and replicate successful formats. If tutorials hold attention better than vlogs across the last 10 uploads, double down on tutorials before chasing a new format.
2. Improve retention
Use the audience retention report in the Engagement tab to find exactly where viewers drop off. YouTube highlights four labeled moments in this report: Intro, Top Moments, Dips, and Spikes. A steep drop in the Intro window means rewriting the opening; a Dip in the middle means cutting or repacing that section.
3. Optimize for discovery: YouTube traffic sources explained
The Reach tab breaks down where viewers came from: YouTube search, browse features, suggested videos, end screens, external sources, and channel pages. Each source carries a different signal. Search-driven views mean SEO is working; browse-driven views mean the algorithm is pushing the video to home feeds; suggested views mean the topic is adjacent to videos viewers already like. For tips, see YouTube SEO for descriptions.
4. Track live stream engagement
Streaming continues to be a major growth lever. Monitor peak chat activity, concurrent viewers, and average watch time per stream to improve future broadcasts. You can also use Gyre to broadcast pre-recorded video as a 24/7 live stream and build cumulative watch time during hours you aren't producing live. Learn more with live stream analytics.
How do you read the Audience tab in YouTube Studio?
The Audience tab answers one question: who is watching, and are they coming back? YouTube's own documentation notes that channel impressions are segmented by new and returning viewers, which makes this the most useful tab for loyalty diagnosis. Three sub-sections do the heavy lifting:
- New vs returning viewers: a healthy channel grows both. If returning viewer share drops while new keeps climbing, your loyalty loop is broken: audiences discover you but don't stay.
- Audience demographics — age and gender: compare it to the audience you intend to reach. A 25–34 male skew on a beauty tutorial channel signals that your packaging is misaligned with the target.
- Top geographies and "when your viewers are on YouTube": shows when uploads should be timed for and which language captions or dubs would unlock the most watch time.
A practical rule: open the Audience tab once a week and use the activity heatmap to schedule uploads against your audience's actual viewing windows, not against generic "best time to post" advice.
Case study: how a thumbnail rebuild moves CTR
The fastest measurable win most channels can get from analytics is a thumbnail rebuild. Industry data backs how much movement is realistic.
- VEVO's thumbnail refresh (vidIQ case study). vidIQ documented the VEVO case, where one of the largest music channels on YouTube updated thumbnails across thousands of older videos. The before-and-after replaced cluttered designs with consistent color schemes, bold imagery, and minimal text. vidIQ describes the result as a dramatic CTR lift across the catalog, recovered through a workflow any creator can replicate using the Reach tab.
- What the broader vidIQ data says. A simple thumbnail change can shift CTR by 15–40% according to vidIQ-coached creators. Channels that move from a 3% CTR into the 5–7% range after a thumbnail rebuild are common, but the lift only sticks if retention was already healthy. CTR is the door; retention decides whether the room stays open.
- The diagnostic that triggers a rebuild. High impressions + low CTR + healthy retention is the signature that the algorithm is showing your video but viewers aren't clicking. Pair the redesign with YouTube Studio's native A/B testing for titles and thumbnails to compound the lift.
- What to monitor after. Use YouTube Studio real-time analytics (the last 48 hours of data) to confirm a CTR move before declaring the rebuild a win, then track in the Reach tab over the following 7–14 days.
The lesson: the bottleneck metric is almost never the one you watch most. Read combinations (CTR plus retention plus traffic source) before changing anything.
Advanced tips for YouTube analytics
- Segment audiences: compare engagement between subscribers and non-subscribers. A growing non-subscriber share means your content is reaching cold audiences, which is a precursor to wider reach.
- Experiment with formats: use analytics to test Shorts, live streams, and podcasts side by side. The dedicated Shorts report means short-form experiments no longer obscure long-form numbers.
- Leverage retention analytics: add mid-video CTAs exactly where drop-offs occur, not at predetermined timestamps.
- Export reports: download CSV data for deeper custom analysis when YouTube Studio's built-in views aren't granular enough.
- Ask Studio for diagnosis: instead of digging through tabs, ask the assistant "what changed on my channel in the last 7 days?" and let the AI surface the deltas worth investigating.
Common mistakes creators make with YouTube analytics
- Focusing only on views: views without retention mean nothing to the algorithm. Prioritize watch time and AVD.
- Misreading CTR: high CTR but low retention means misleading thumbnails. You're winning the click but losing the trust.
- Ignoring Shorts data: with 200 billion daily views reported in YouTube's 2026 letter, Shorts is a discovery channel you can't afford to leave unmeasured.
- Not tracking monetization trends: missing which videos deliver the highest RPM and CPM leaves money on the table when you plan future formats.
- Comparing the wrong way: YouTube's documentation recommends benchmarking against your own typical retention, not against generic platform averages.
Avoiding these mistakes ensures cleaner YouTube video performance signals and a more honest read on what the algorithm rewards.
From data to growth: building a smarter YouTube strategy
Data is power only when paired with action. YouTube Studio analytics transforms raw numbers into actionable insights, and with Ask Studio surfacing those insights directly, the gap between "I see the data" and "I know what to do" is the shortest it has ever been. Use the dashboard to:
- Craft binge-worthy playlists that lift session watch time.
- Balance Shorts, live streams, and long-form uploads based on what each format contributes to overall channel growth.
- Optimize retention to satisfy the algorithm's heaviest-weighted signal.
- Diversify monetization across ads, memberships, Super Chats, and Shorts ad-share inside YPP.
FAQ
What is a good CTR on YouTube?
Average CTR sits between 2 and 10%, as vidIQ confirms based on YouTube's own statements. Under 2% usually means thumbnails need work; above 6% is strong. Always compare within your own niche and channel size before judging the number.
How often does YouTube Analytics update?
Most metrics update every 24–48 hours. Real-time data covering the last 48 hours refreshes every few minutes inside YouTube Studio. YouTube Help notes there can be a delay of a few days before some data is fully viewable, and that estimated earnings data carries an approximate two-day delay.
Can I see analytics for individual Shorts?
Yes. Go to Content > Shorts in YouTube Studio to see Shorts-specific metrics including swipe-away rate, the view vs. swipe split, and the Shown in Feed chart.
What does "Shown in Feed" mean in analytics?
Shown in Feed is a Shorts-specific metric that shows how often your Short appeared in the YouTube Shorts feed. It works alongside the standard impressions metric (which covers thumbnail appearances across the home feed, search, and suggested videos for long-form) and helps you see whether your Shorts are being surfaced by the algorithm in the first place.